#1 Production Tracking Software
Guidewheel's sensor clips around a machine's power conductor and reads its electrical heartbeat, so every run, every stop and every cycle is recorded in real time.
Track production on any machine that uses power, whatever its age, make or model, and compare actual cycle times against your targets.
No PLC, no MES, no IT project.
Get a Guidewheel demo and learn how to reduce downtime and increase production

Trusted by 500+ leading manufacturers













Real-world results
What changed on their floor
 Pack Labs reduces downtime by 40% in just six months
Learn More→
Case Study
Pack Labs reduces downtime by 40% in just six months
Learn More→
Case Study
 Fibrix Filtration achieves 92% uptime annually with Guidewheel
Learn More→
Case Study
Fibrix Filtration achieves 92% uptime annually with Guidewheel
Learn More→
Case Study
 Nice House of Plastics reduces weekly idle time by 67% with Guidewheel
Learn More→
Case Study
Nice House of Plastics reduces weekly idle time by 67% with Guidewheel
Learn More→
Case Study
 Penn Color increases asset utilization by over 30% with Guidewheel
Learn More→
Penn Color increases asset utilization by over 30% with Guidewheel
Learn More→
Keep machines up and costs down
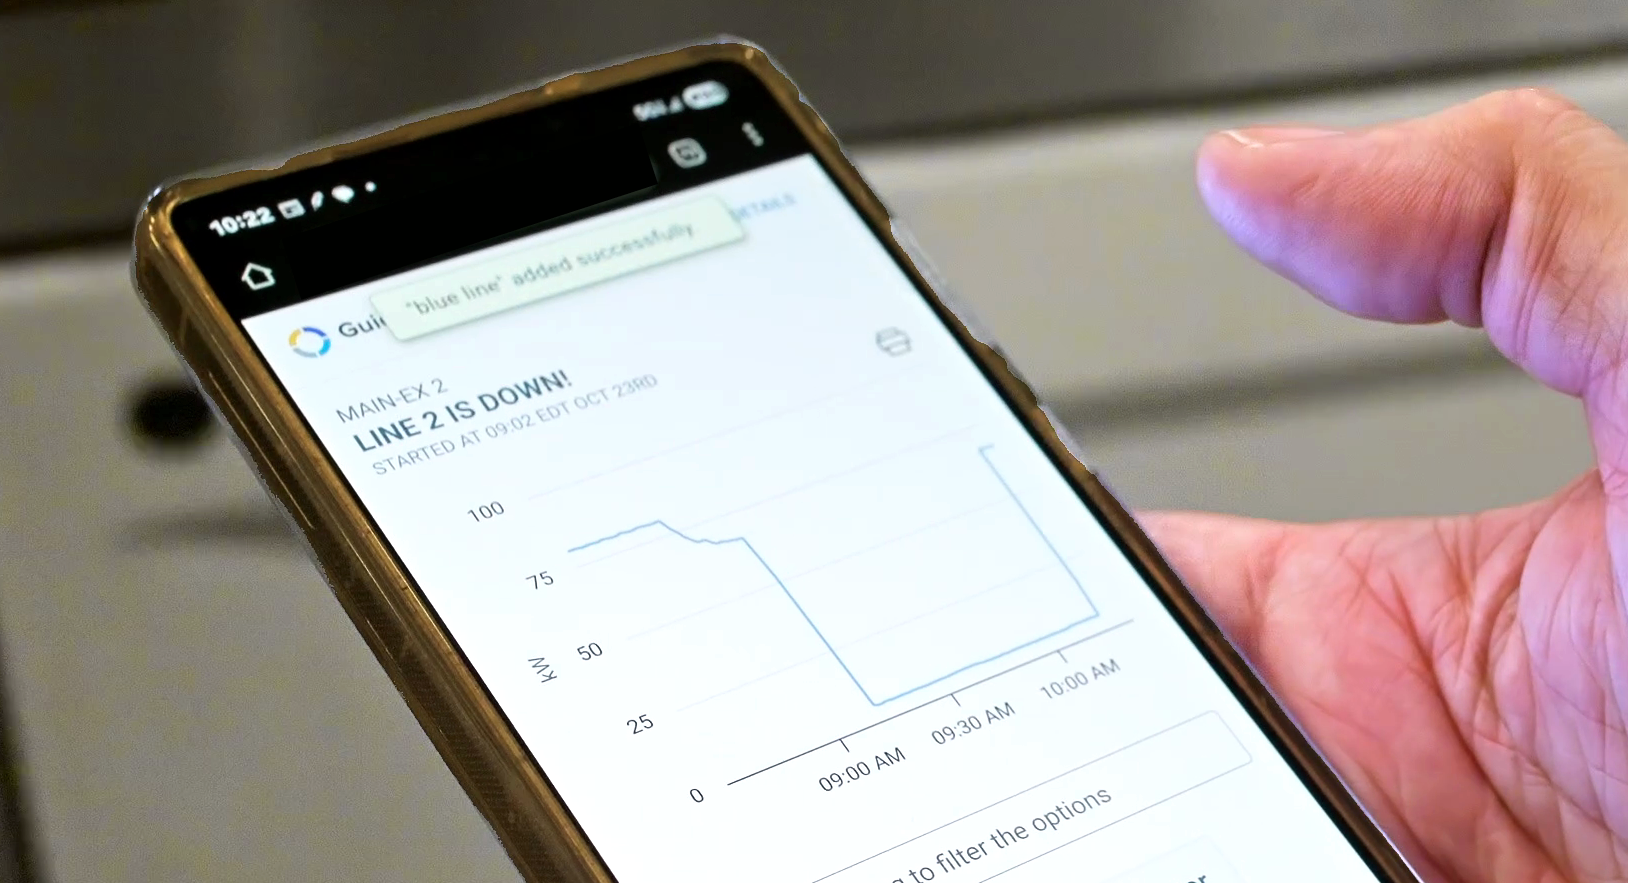
Respond faster to downtime
Get alerts and real-time visibility into downtime so your teams can respond quickly, without waiting on shift or weekly reports.
Focus on your most costly issues
Zero in on your top downtime drivers by machine, shift, or issue type, and direct resources where they’ll have the biggest impact.
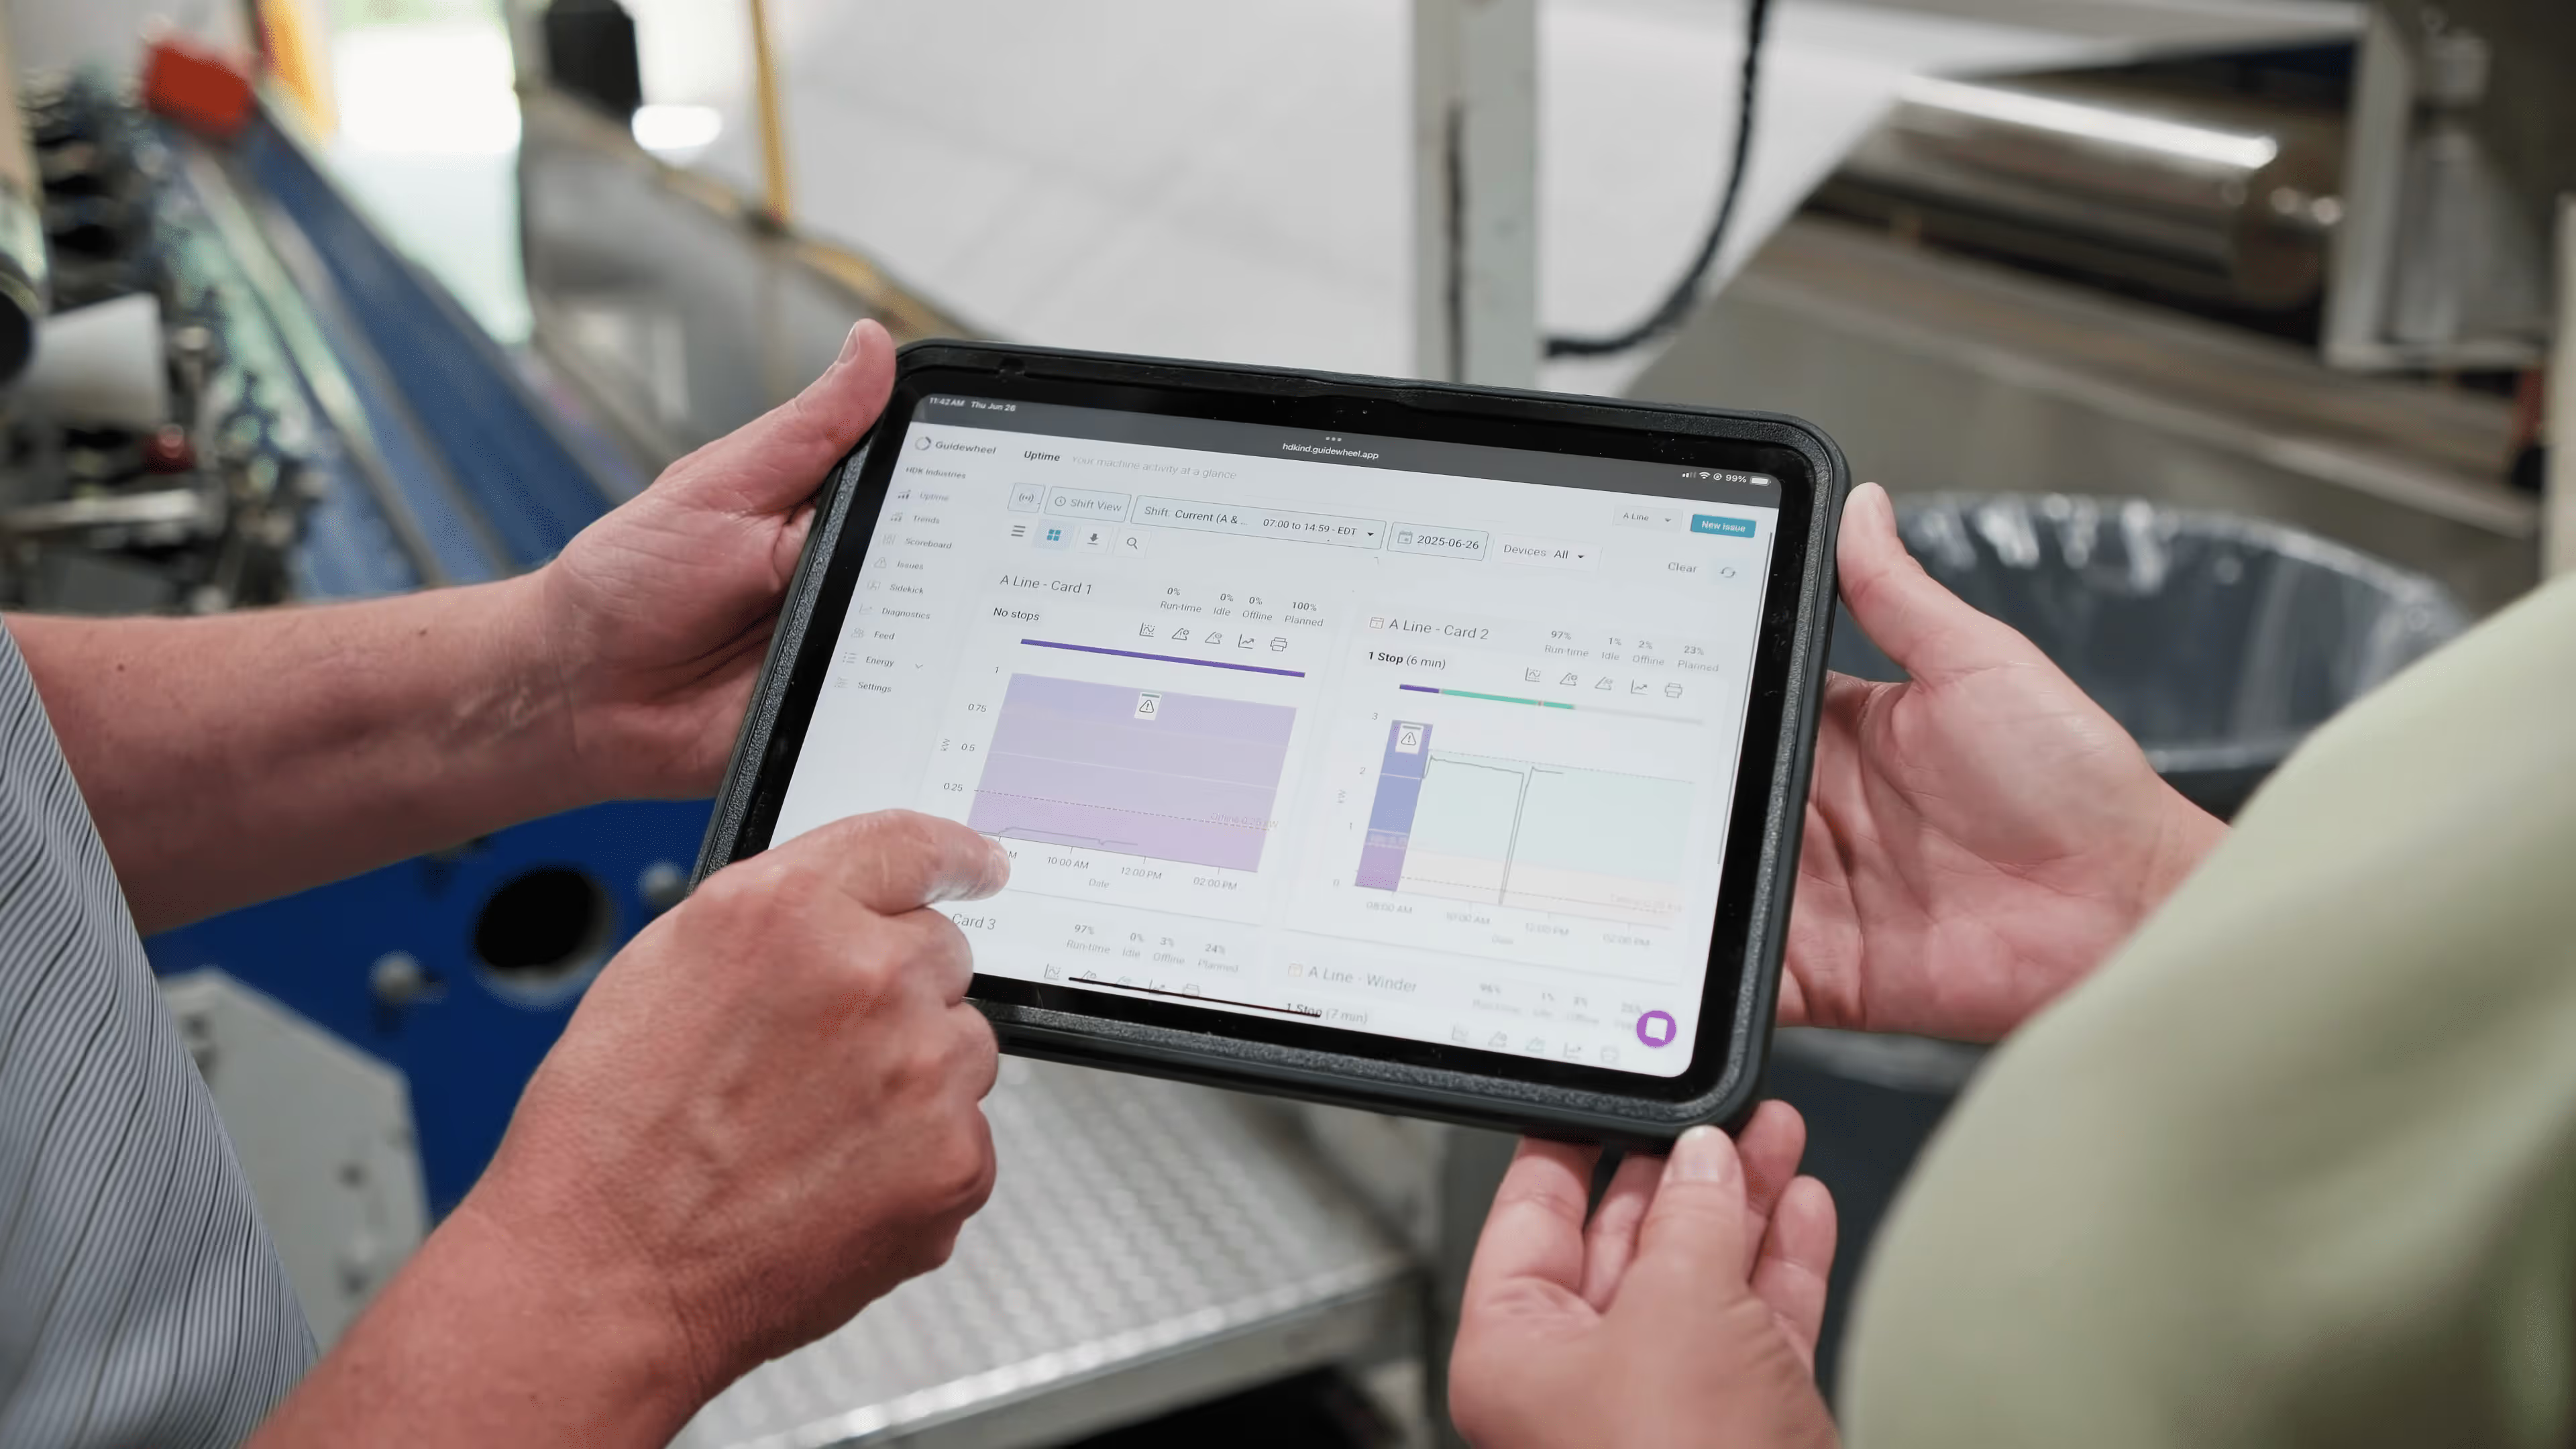
Recover hidden downtime
Identify and eliminate costly delays like slow changeovers, late starts, and microstops, that add up over time.
Lay the foundation for predictive action
Track downtime in real time today and be able to scale with AI, condition monitoring, and integrations to stay ahead of failures tomorrow.
.avif)

92% uptime for a full year on Fibrix’s most critical line
Real-time visibility into downtime and machine performance through Guidewheel helped the Fibrix team resolve key issues, align their teams, and achieve over 90% uptime for an entire year on their most critical line.

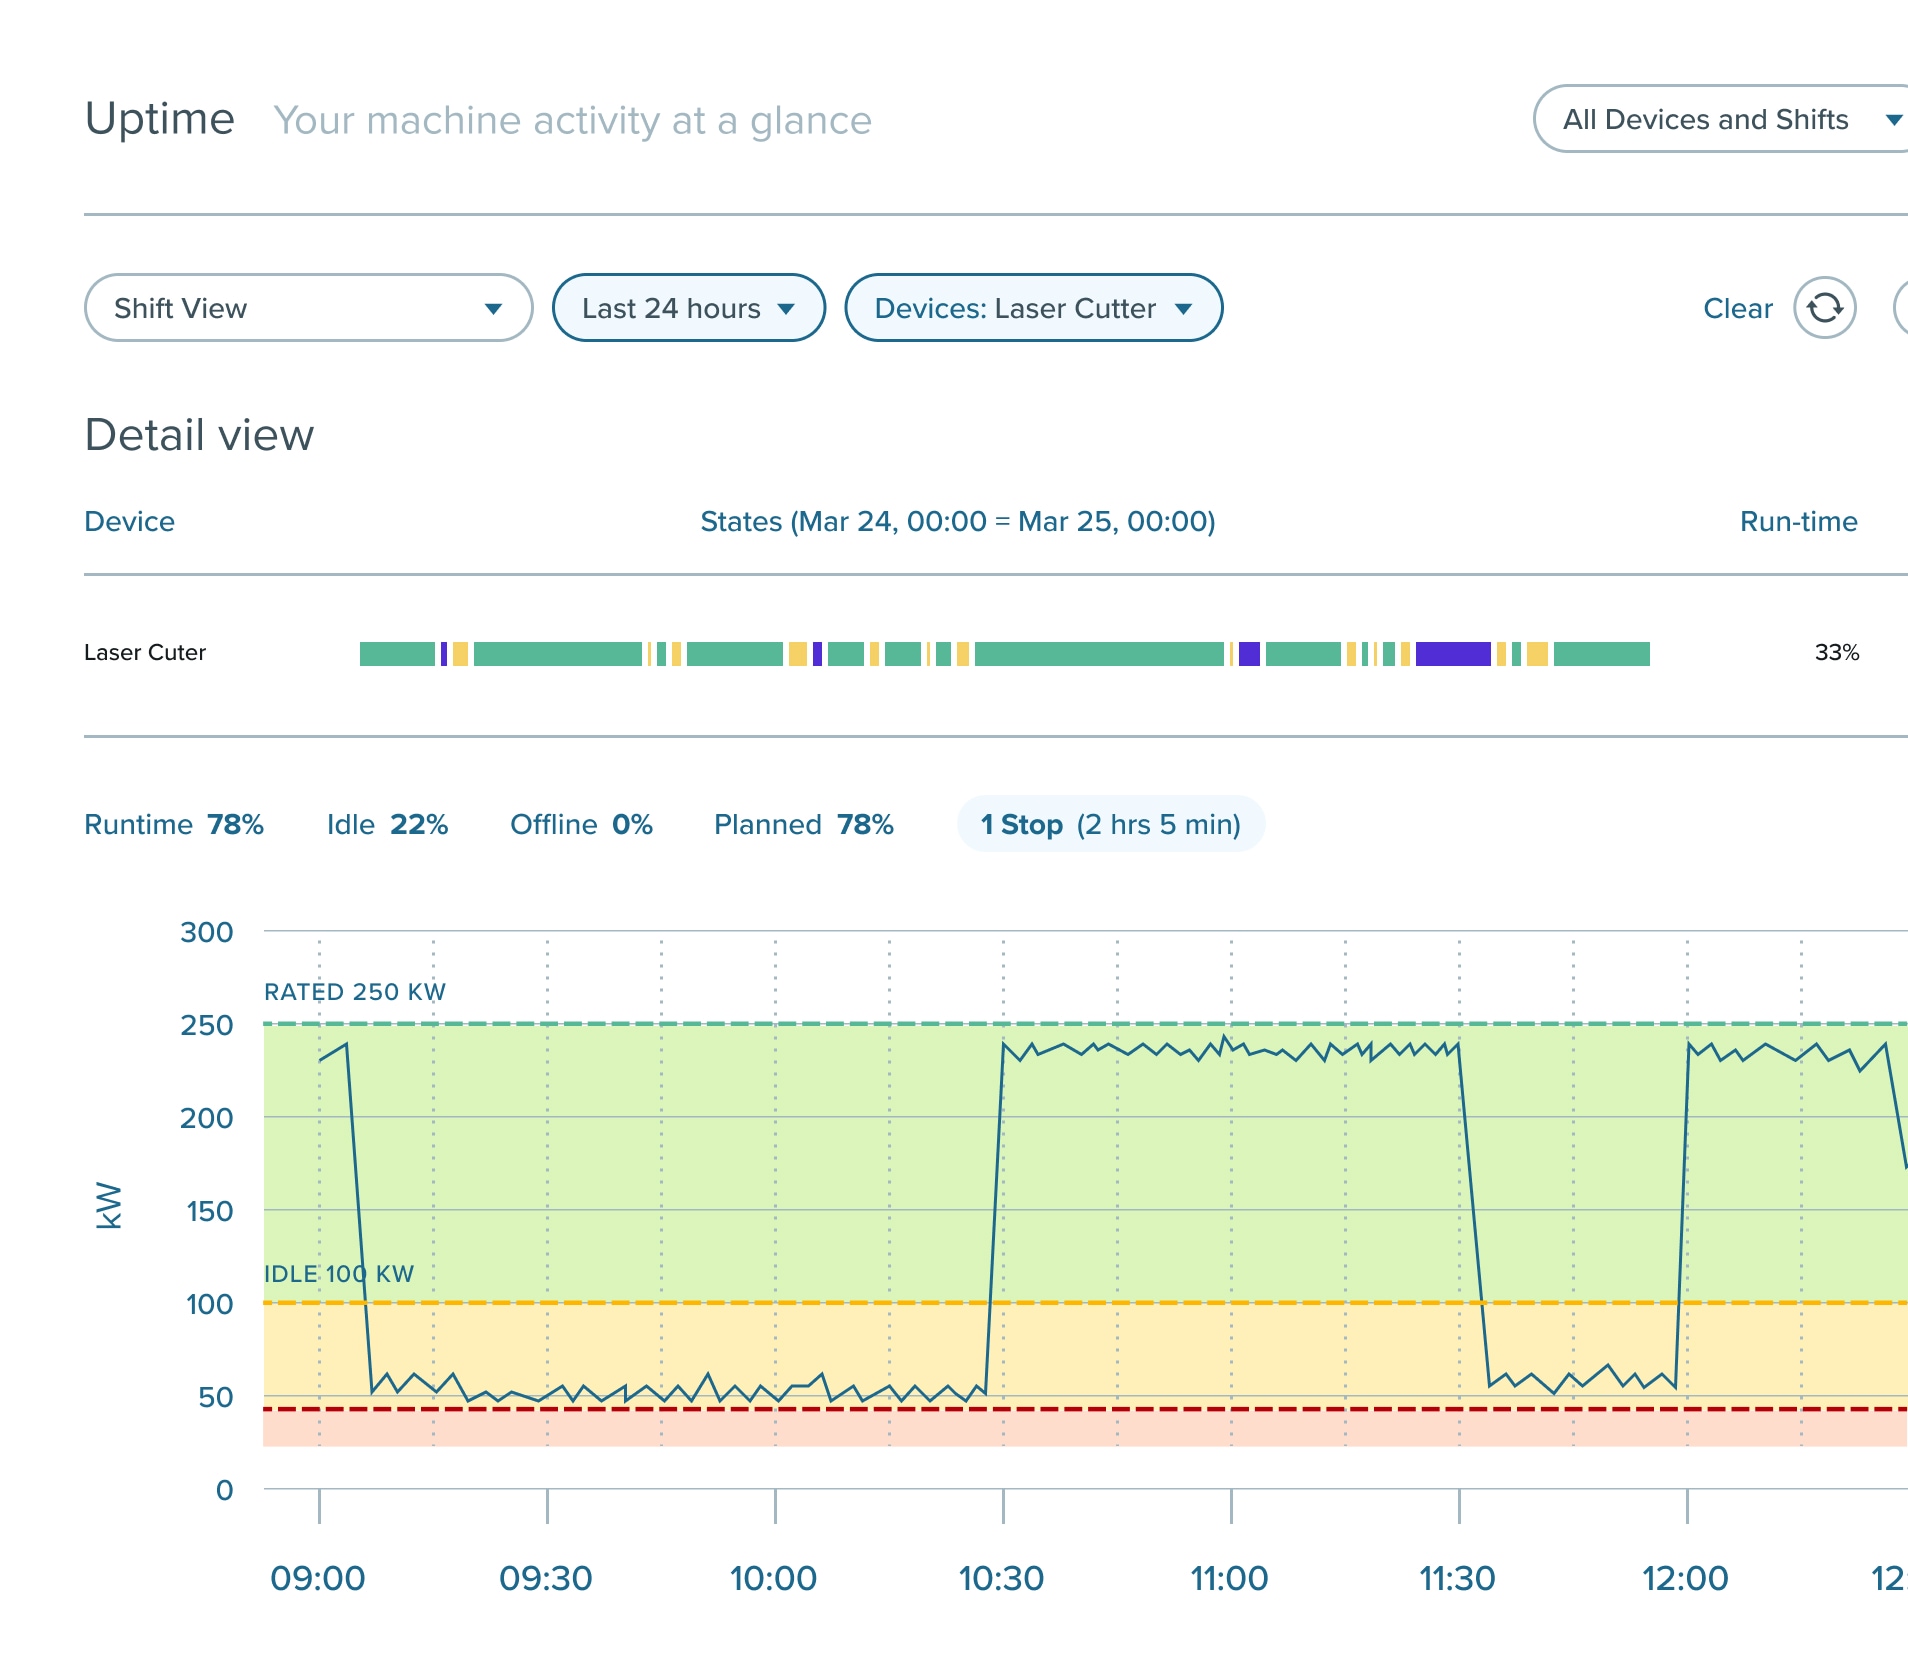
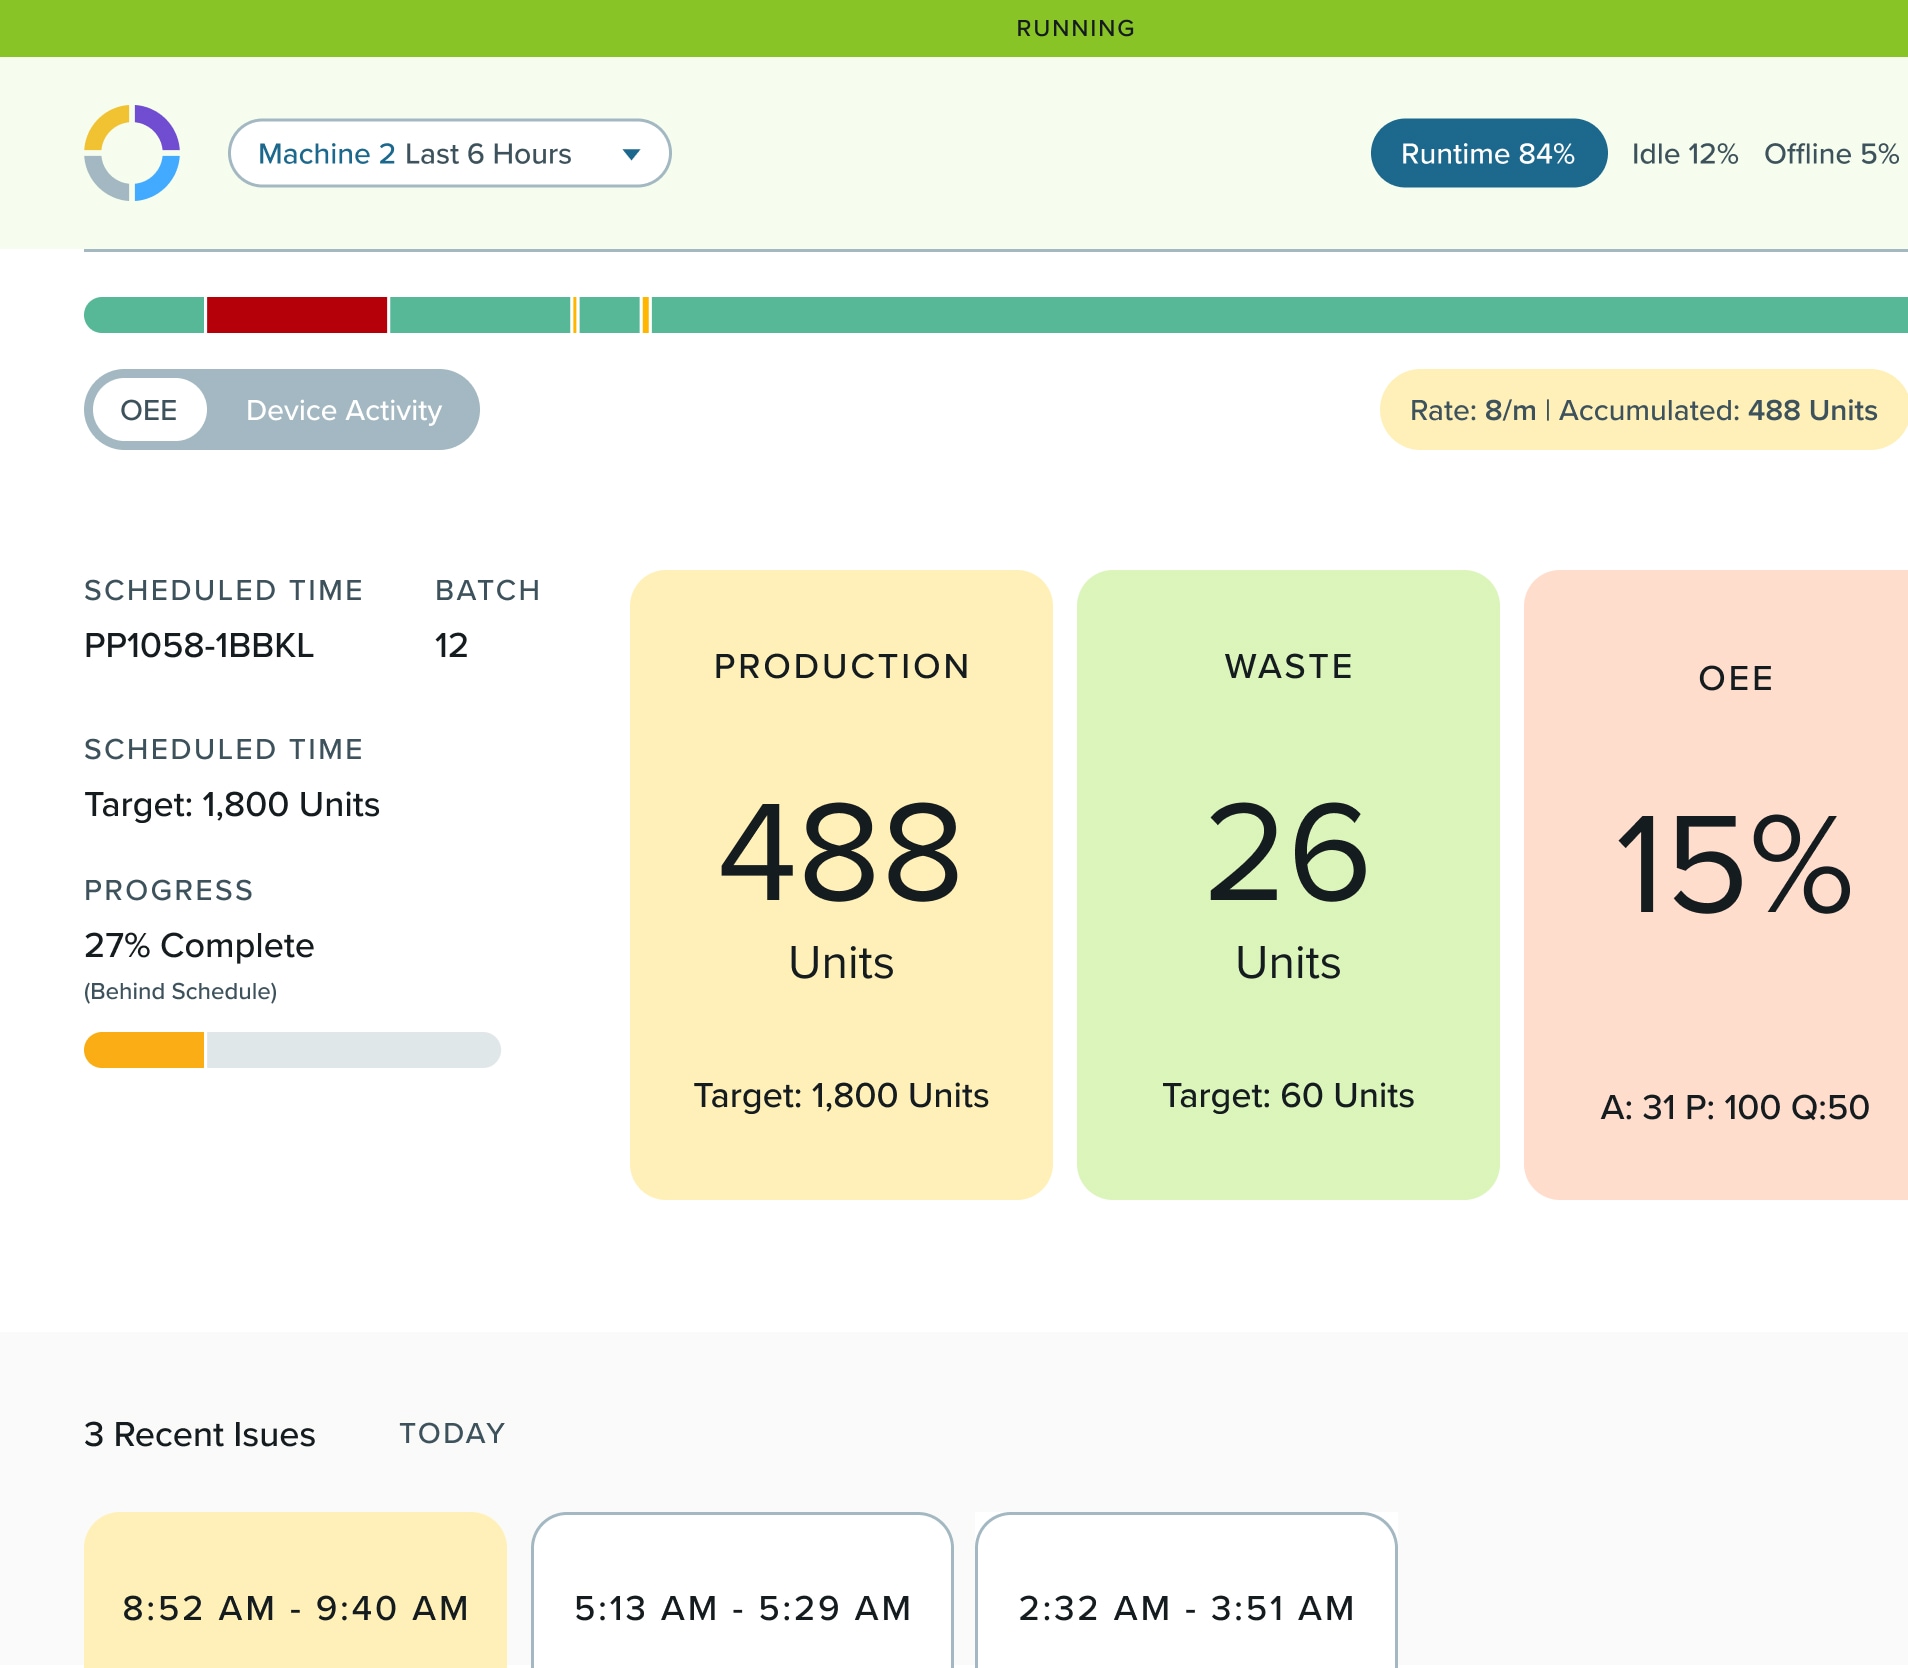
Uptime View
Monitor whether machines are running, idle, or down, and why. With real-time visibility into runtime, your teams can jump on issues before they impact production.
- See live machine status from any device
- Know duration and reason for all downtime events
- Spot and resolve issues as they happen
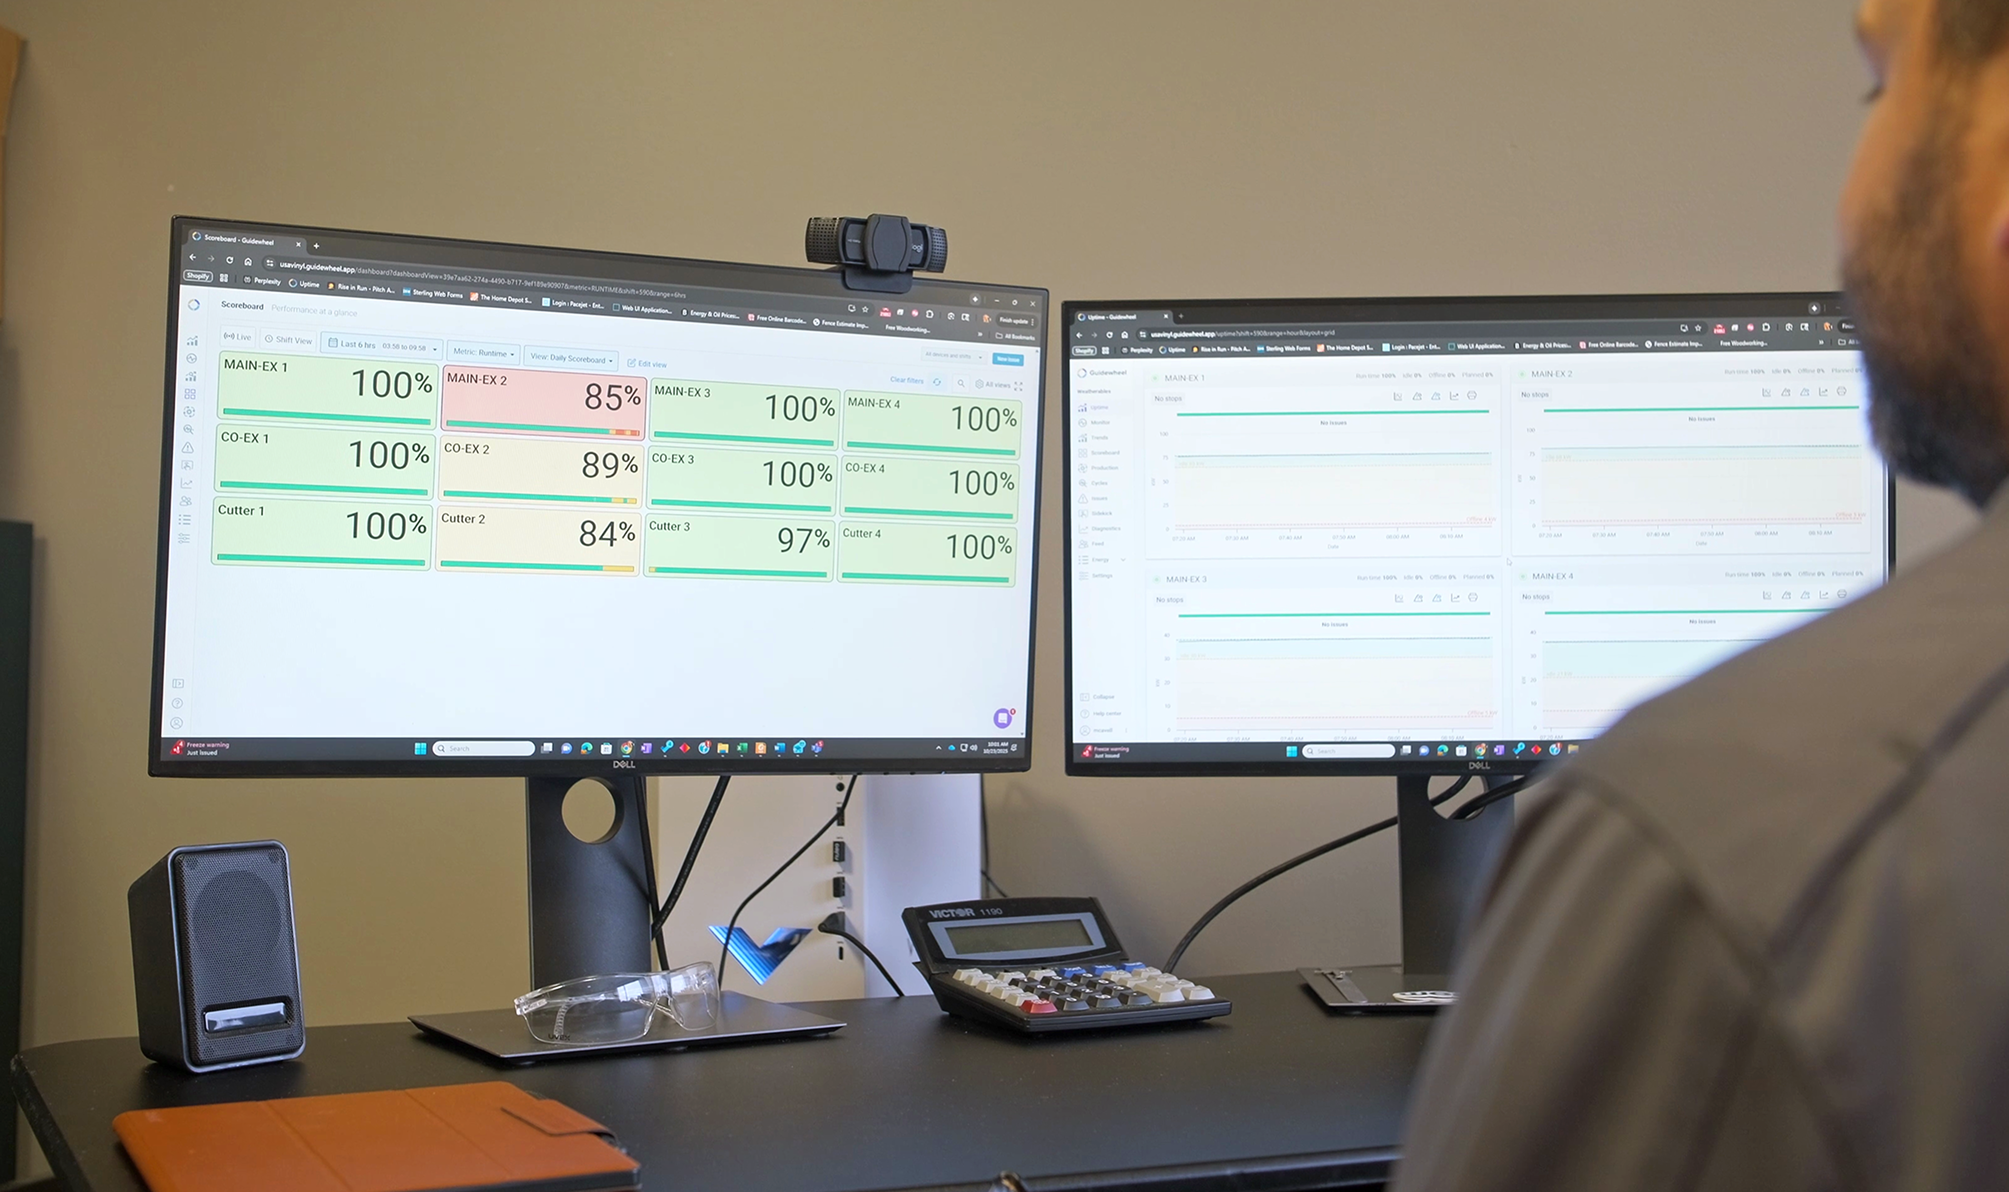
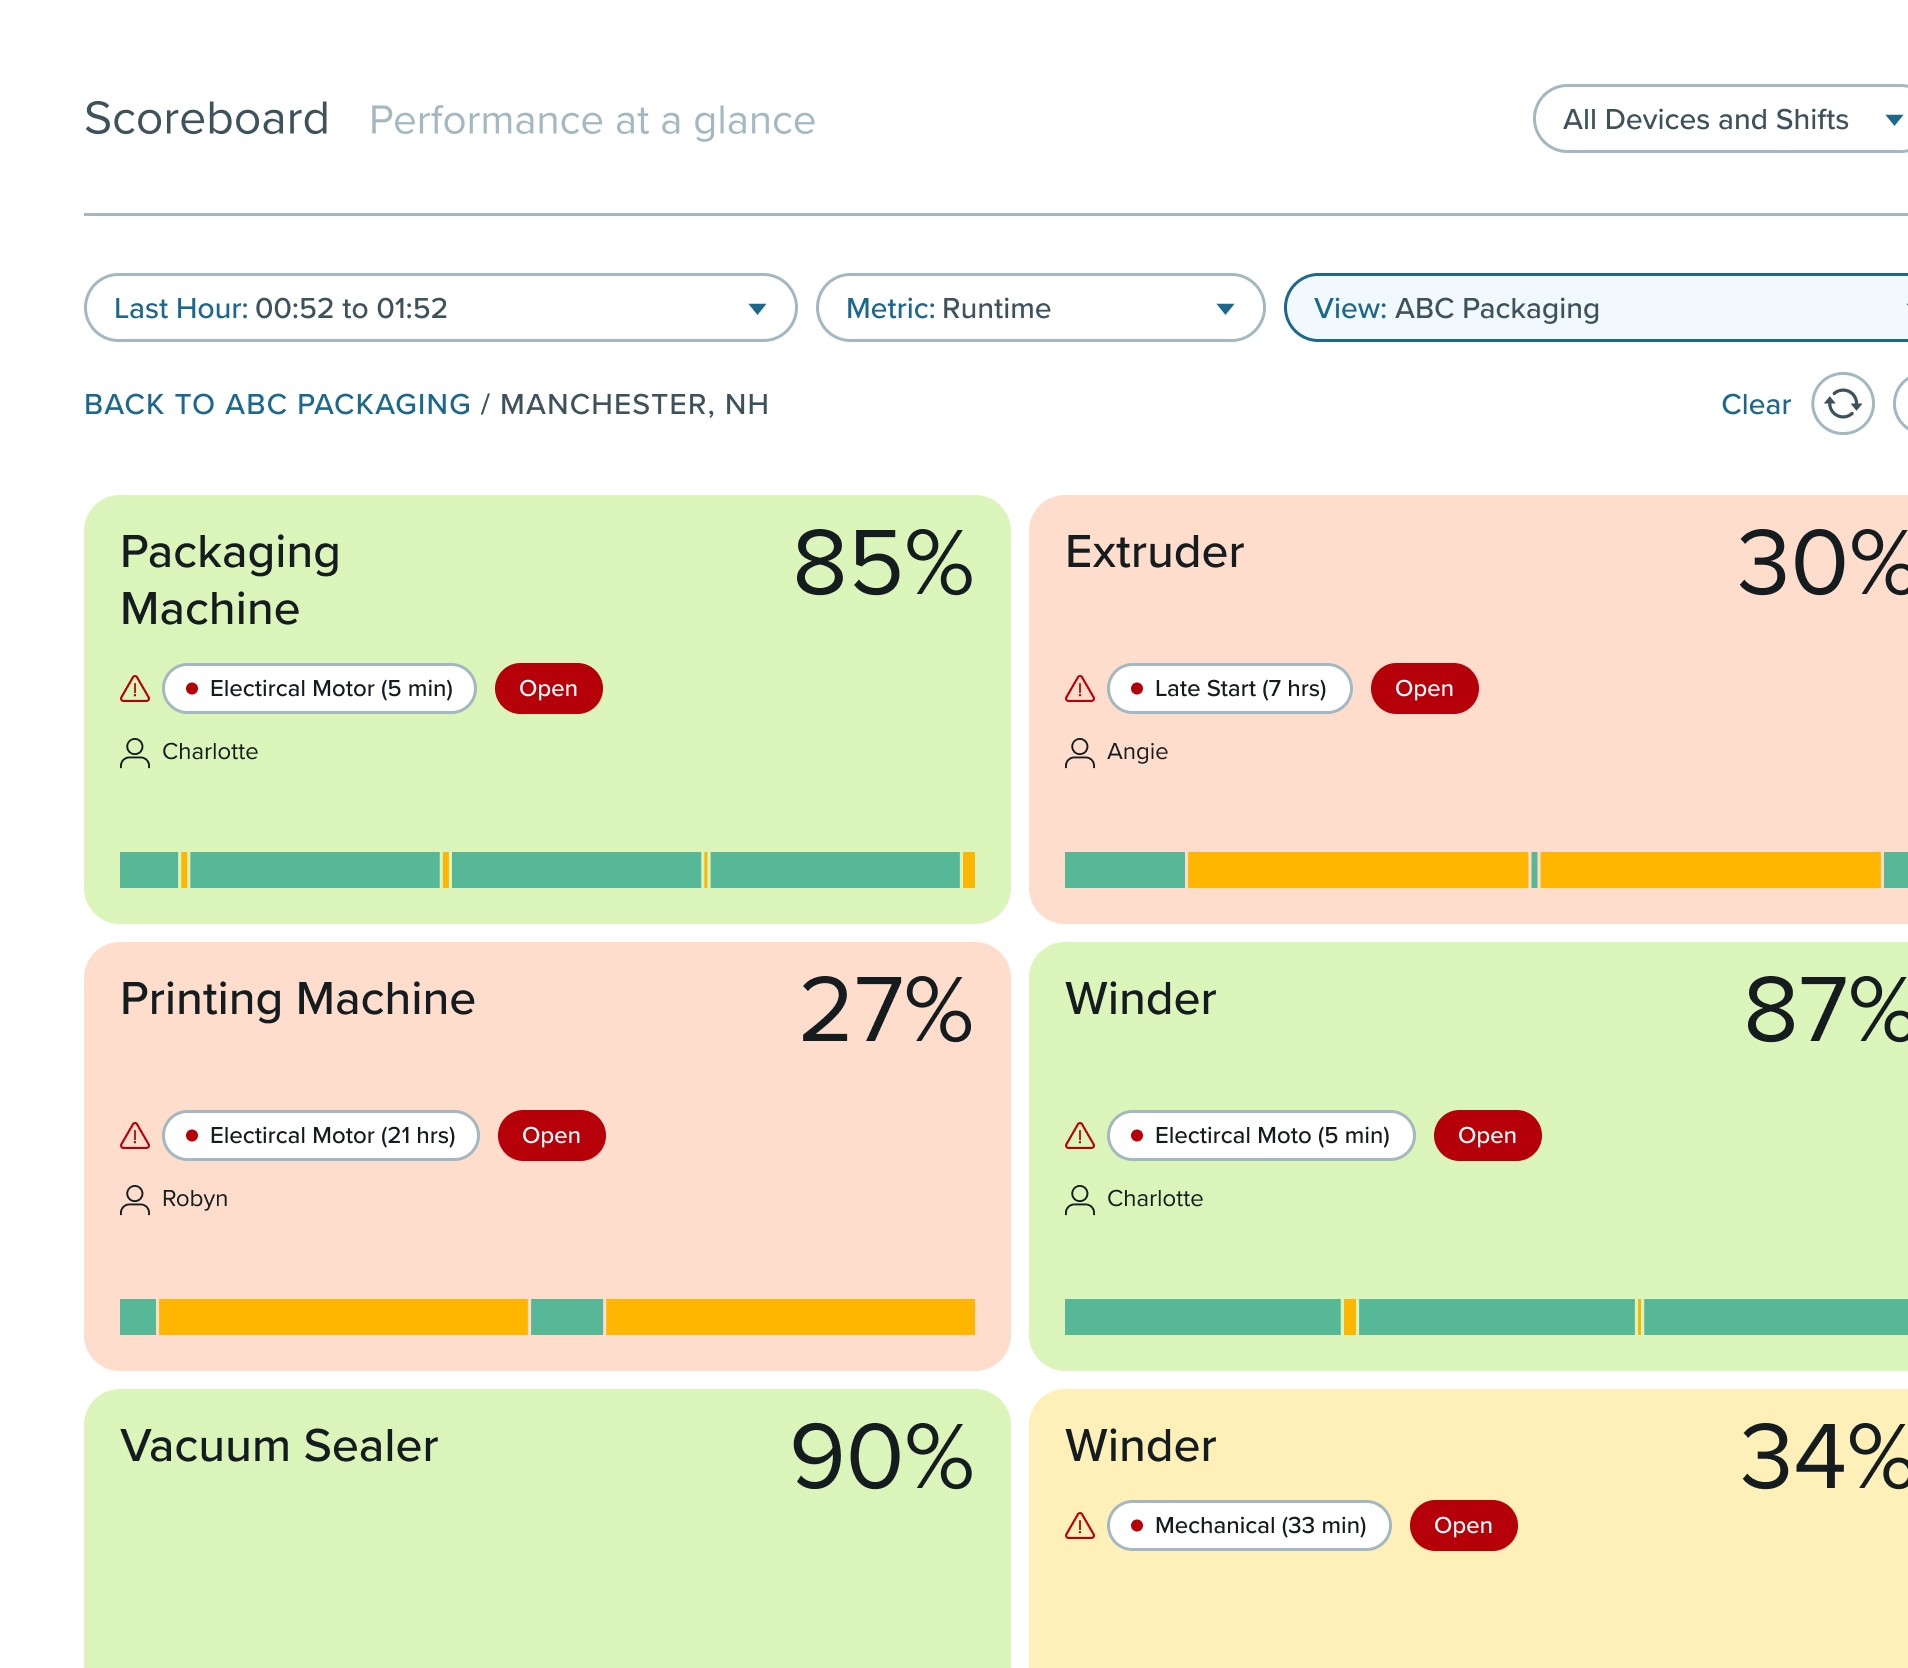
Scoreboards
Get complete visibility into factory performance across every line, shift, and site. Guidewheel’s scoreboards surface key metrics in real time, so your teams can stay aligned, act fast, and stay on target.
- Live dashboards with views at the machine and plant level
- Updates in real time across all shifts
- Display key metrics like runtime, OEE, and more
Mobile Alerts
Ensure your teams are instantly notified when downtime, overloads, or anomalies occur, no matter where they are.
- Detect downtime or performance drops in real time
- Alert the right person instantly
- Keep output steady across every shift
.png)
Operator Dashboard
Give operators the tools to flag downtime, log issues, and keep lines moving in real time.
- Tag downtime events and request maintenance support in just a few taps
- Record scrap reasons without slowing down production
- Feed real-time insights from the floor directly into your team’s decision-making
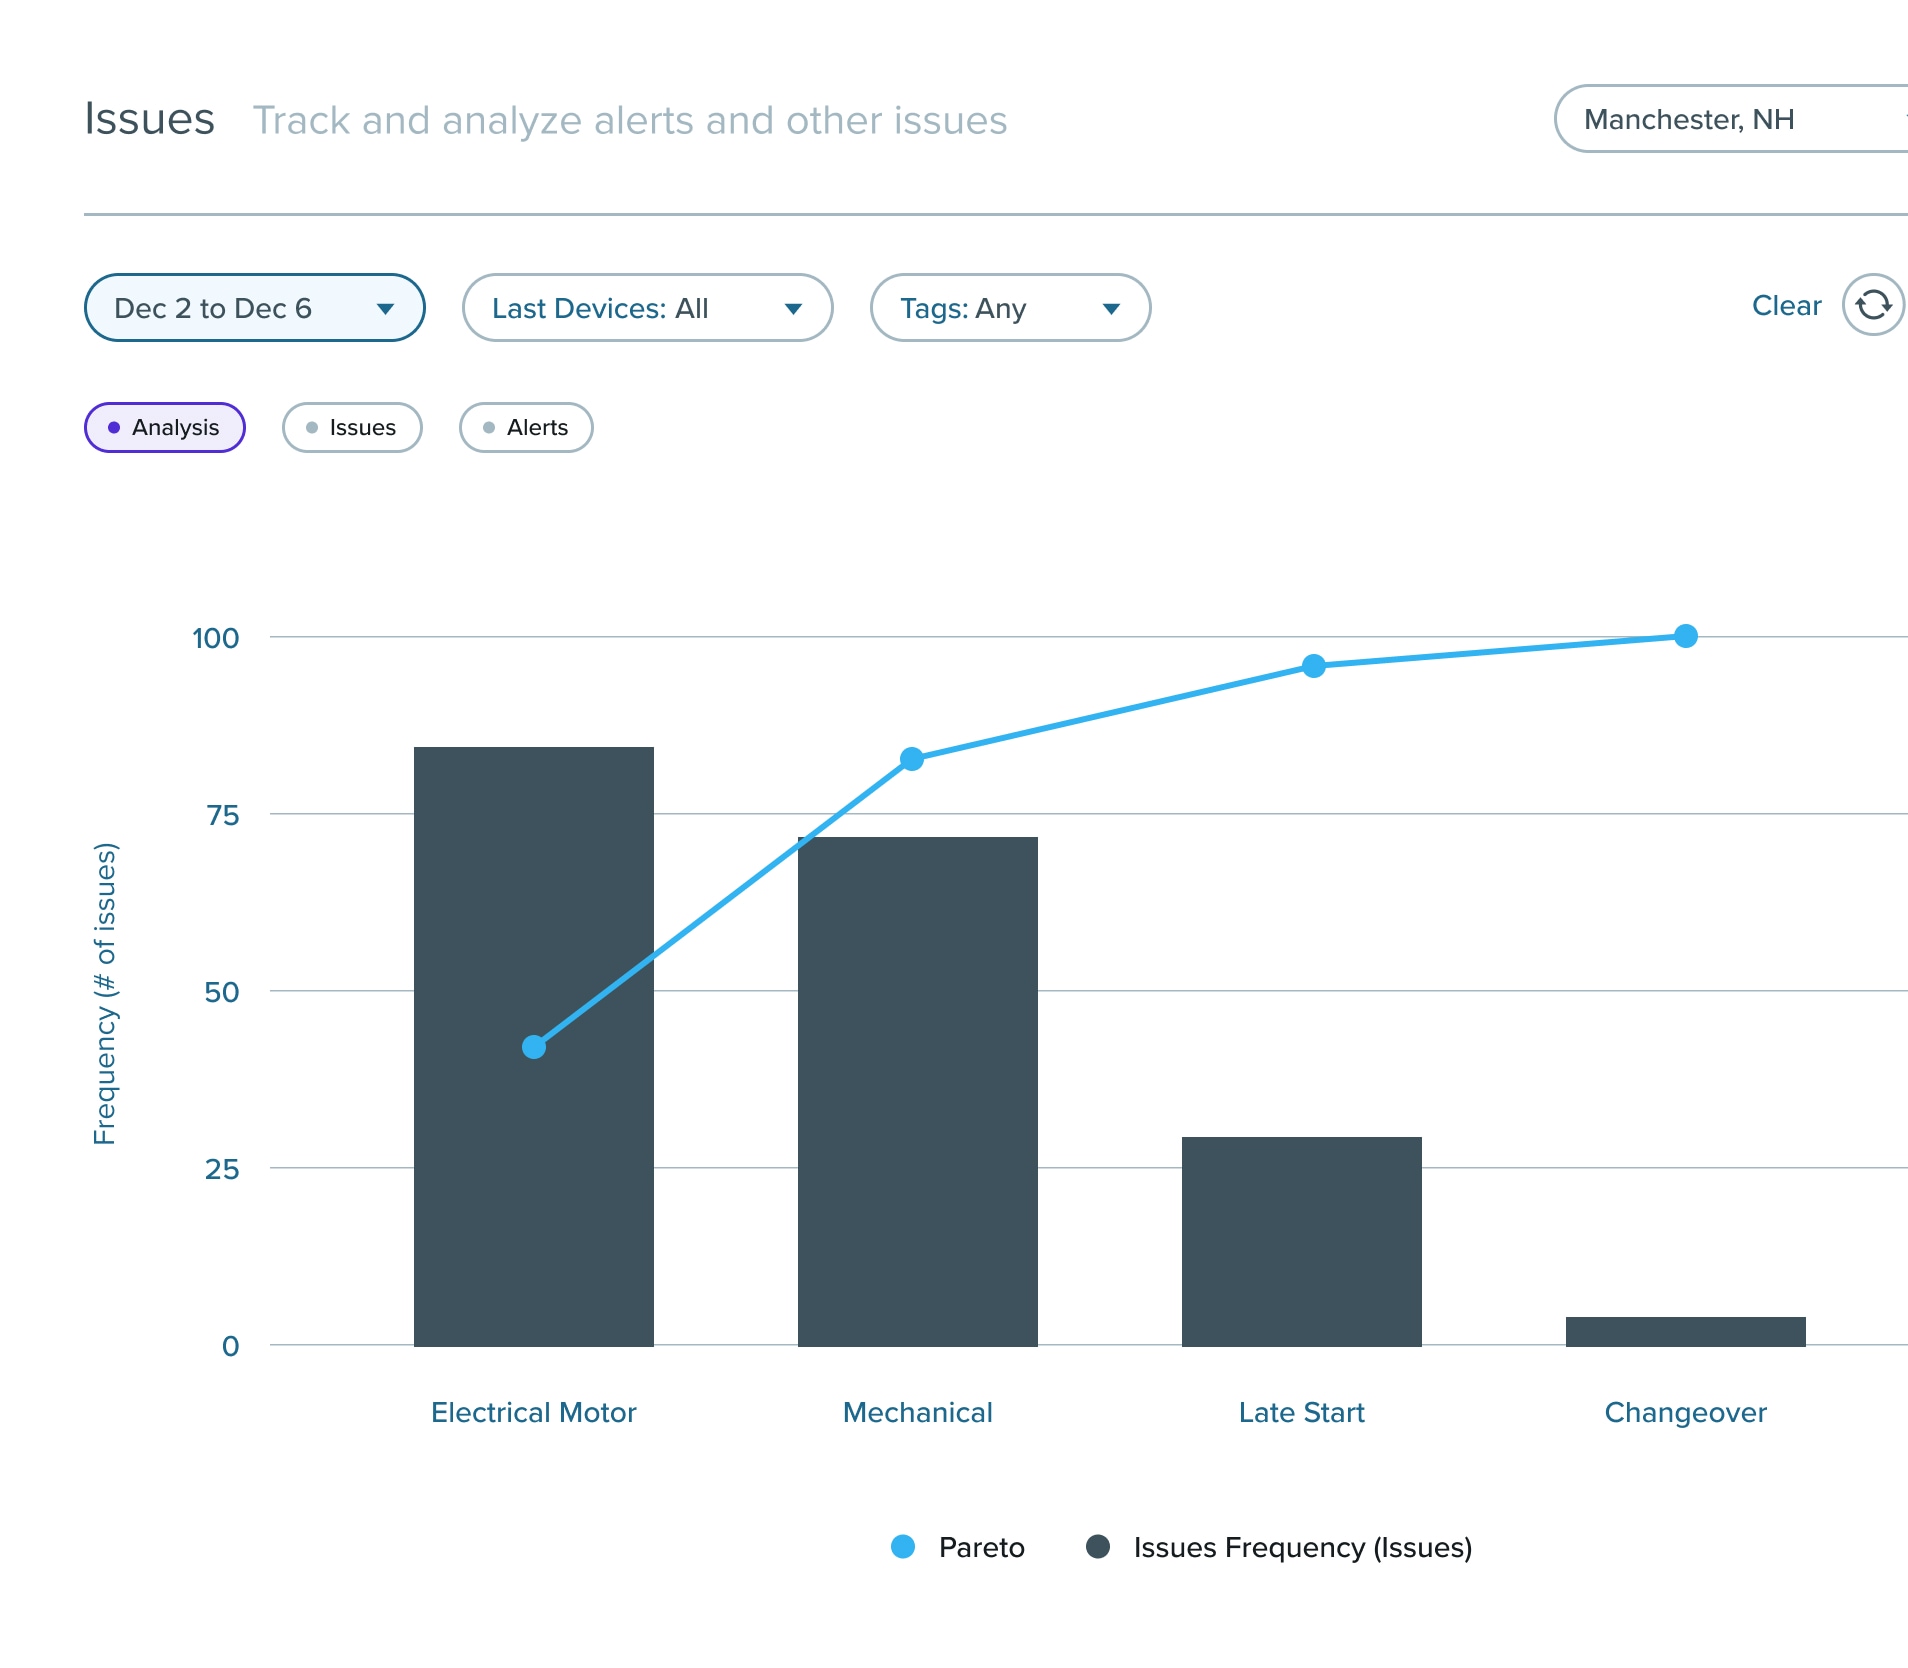
Pareto Analysis
Pinpoint and address your biggest downtime drivers to focus resources where they’ll have the most impact.
- Identify top downtime drivers by machine or type
- See which problems are costing you the most time
- Prioritize improvements based on data, not assumptions
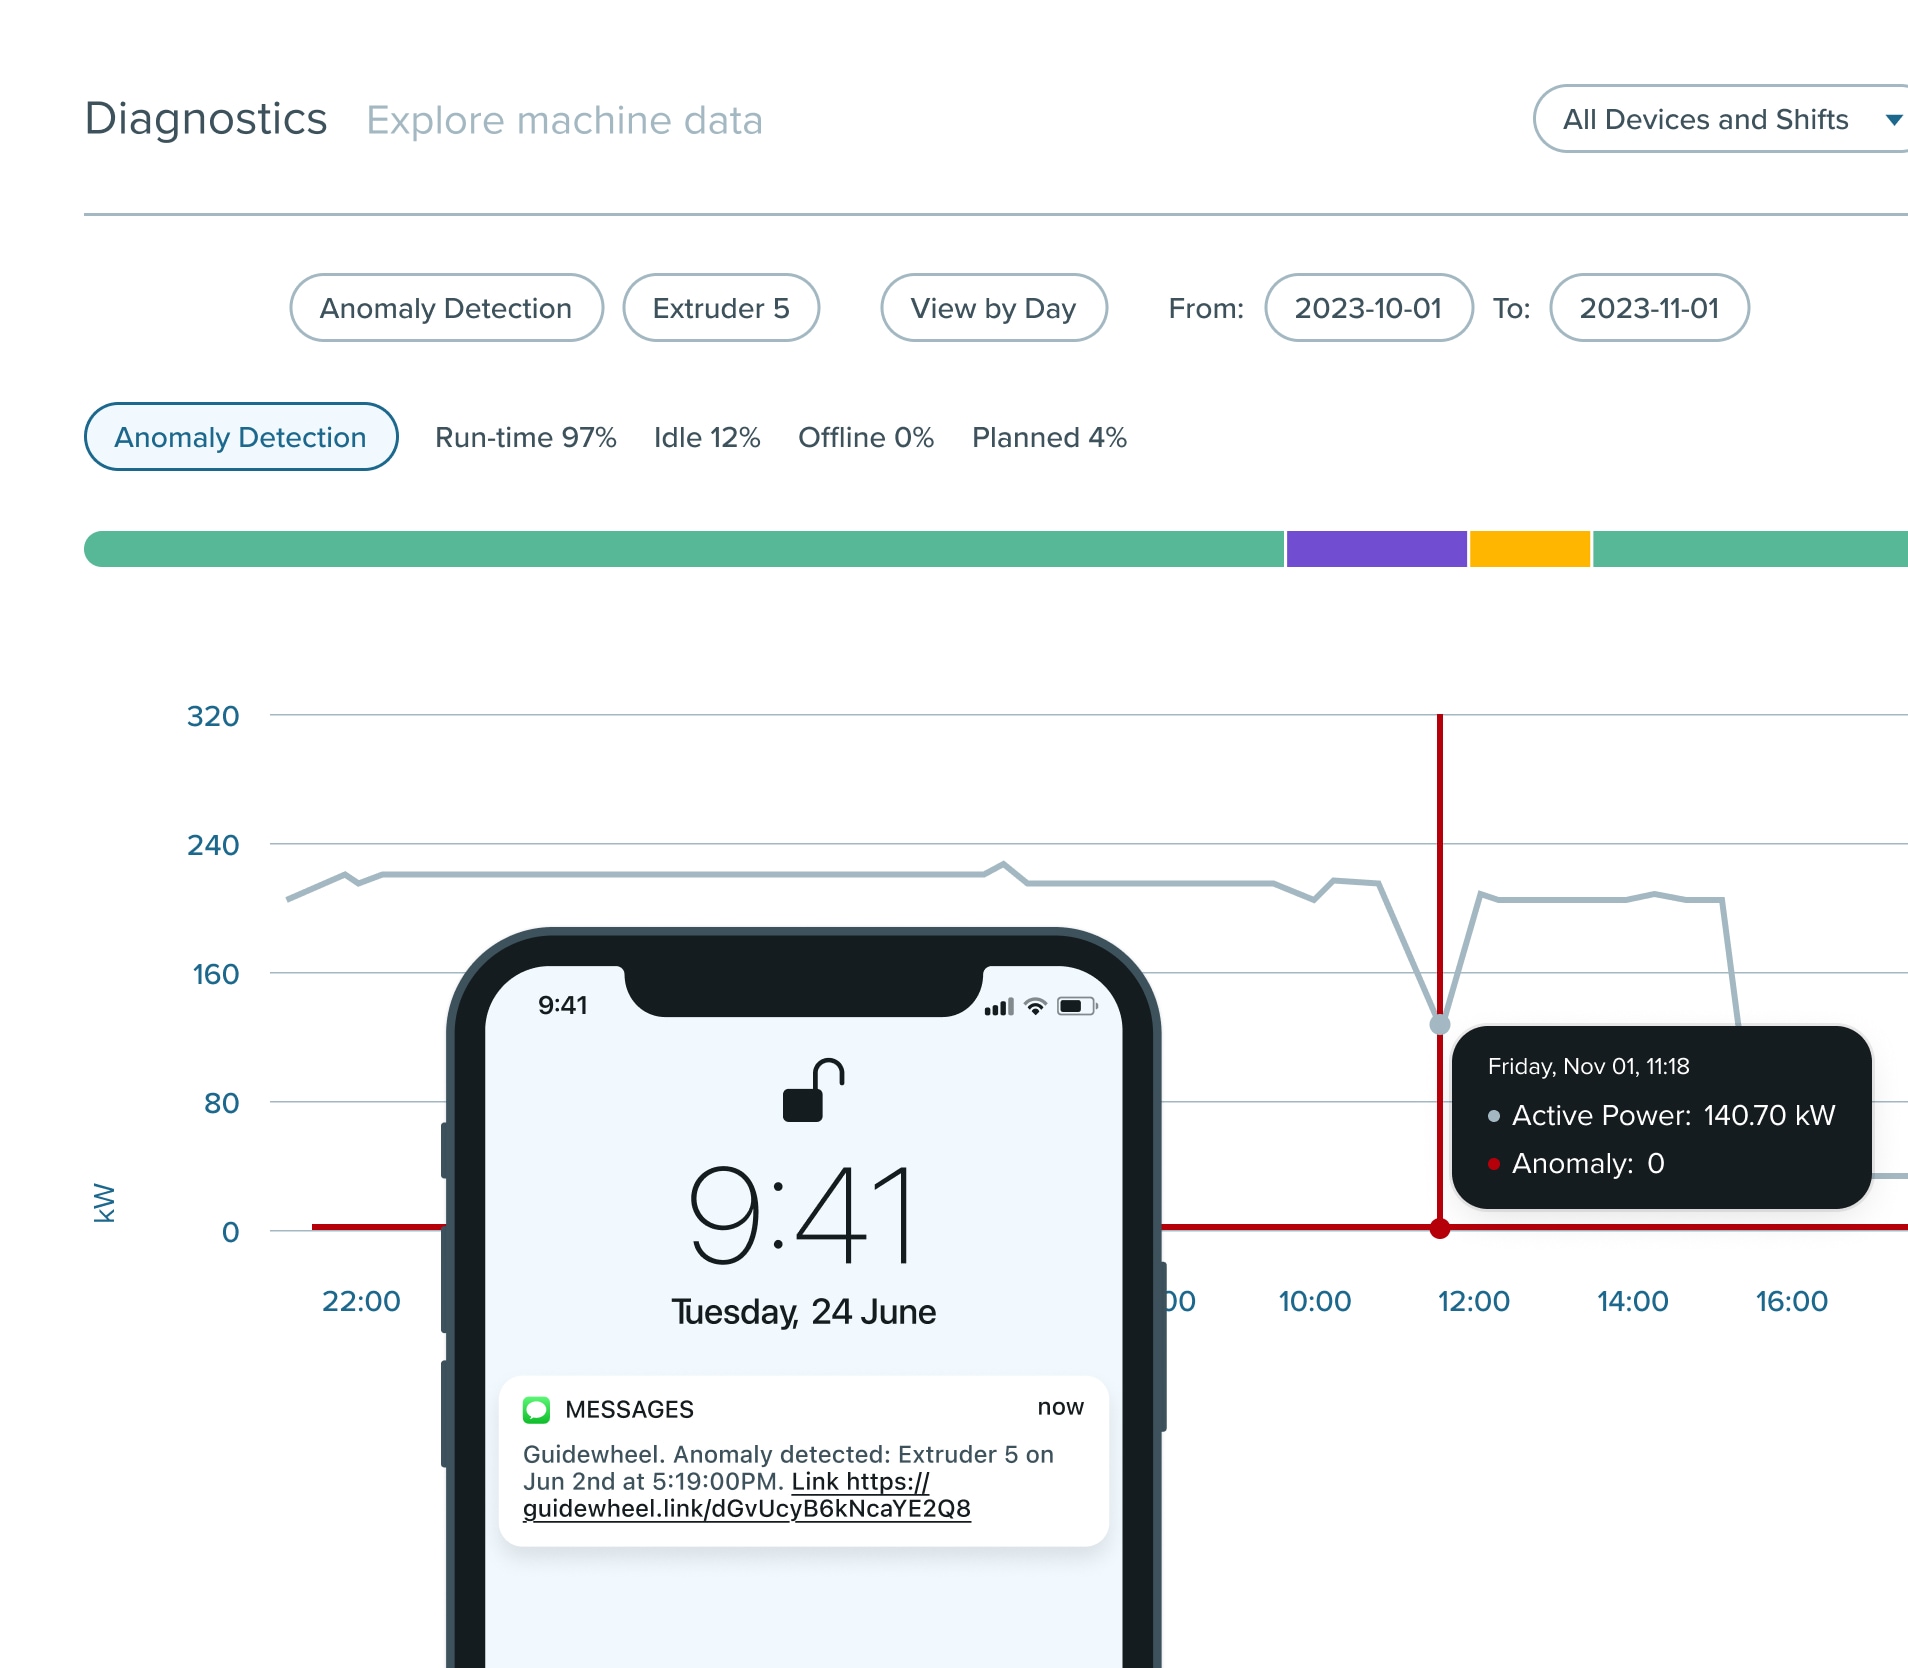
AI-Powered Anomaly Detection
Catch abnormal machine behavior before it leads to a major failure.
- Detect subtle deviations from normal performance patterns
- Surface potential issues that manual checks may miss
- Take preventative action to avoid costly unplanned stops

Frequently Asked Questions
The sensor clips around the machine's power conductor and reads its electrical heartbeat, so run, idle and down are recorded from the machine itself. Cycles are tracked in real time off that same signal, and you can compare actual cycle times against your targets. Nobody has to write a tally at the end of the hour for the record to exist.
Yes. Guidewheel forecasts throughput and tracks planned versus actual production alongside uptime, OEE and cycle times, and machine-specific OEE can be displayed on the plant floor so the floor sees where the hour stands. That is the difference between a number you review tomorrow and a number you can still act on.
Yes. Every stop is timed from the moment the machine stops drawing power, operators tag the reason in a few taps on a stop that is already recorded for them, and Pareto ranks your top drivers by machine, shift or reason. The shortfall stops being a total and becomes a list you can work down.
Operators record scrap reasons in Guidewheel in a few taps, and those reasons roll up with the rest of your production data. Guidewheel reads the machine rather than the part, so quality data comes from what your team records, against a machine record that already exists. Teams use it to cut scrap, but the sensor is not an inspection system and we do not present it as one.
Any machine that uses power, regardless of age, make or model. The sensor clips around the power conductor instead of connecting to your controls network, so there is no PLC integration and no per-machine controller to buy.
You do not have to. Our team can install Guidewheel for you, and most sites are running in about a day, with live machine data within hours of sensor install. Dedicated onboarding and ongoing support come with every plan, in person or virtual. You also do not need existing infrastructure: the sensors reach the cloud over ethernet, WiFi or LTE, depending on what the site already has.
No. Guidewheel sits alongside what you already run. It connects to ERP, CMMS and BI tools through native connectors or an open API, and the sensor clips around the power conductor rather than joining your controls network.
Pricing is published. It starts at $15,000 a year and includes your first 10 machines, with dedicated onboarding and ongoing support from our team, in person or virtual. You do not need existing infrastructure: the sensors reach the cloud over ethernet, WiFi or LTE, depending on what the site already has. No quote to chase, you can see the current figure on our pricing page before you ever speak to us.
Ready to see the shift while it is still running?
Let's talk about how Guidewheel turns run, idle, down and cycle data from your own machines into a production number your whole team can act on before the shift ends.