See where downtime costs you.
Find where to act.
Guidewheel connects machines across ages and makes, giving your team a real-time view of where production time is going. Sensors connect to a machine's power cable without requiring PLC integration to start. Then our AI-powered software and team pinpoint your highest-value next move and help it stick across every shift and plant.
See Guidewheel on your floor

Trusted by 500+ leading manufacturers











Real-world results
What changed on their floor
 Fibrix Filtration achieves 92% uptime annually with Guidewheel
Learn More→
Case Study
 Pack Labs reduces downtime by 40% in just six months
Learn More→
Case Study
 Nice House of Plastics reduces weekly idle time by 67% with Guidewheel
Learn More→
Case Study
 Penn Color increases asset utilization by over 30% with Guidewheel
Learn More→
Keep machines up and costs down
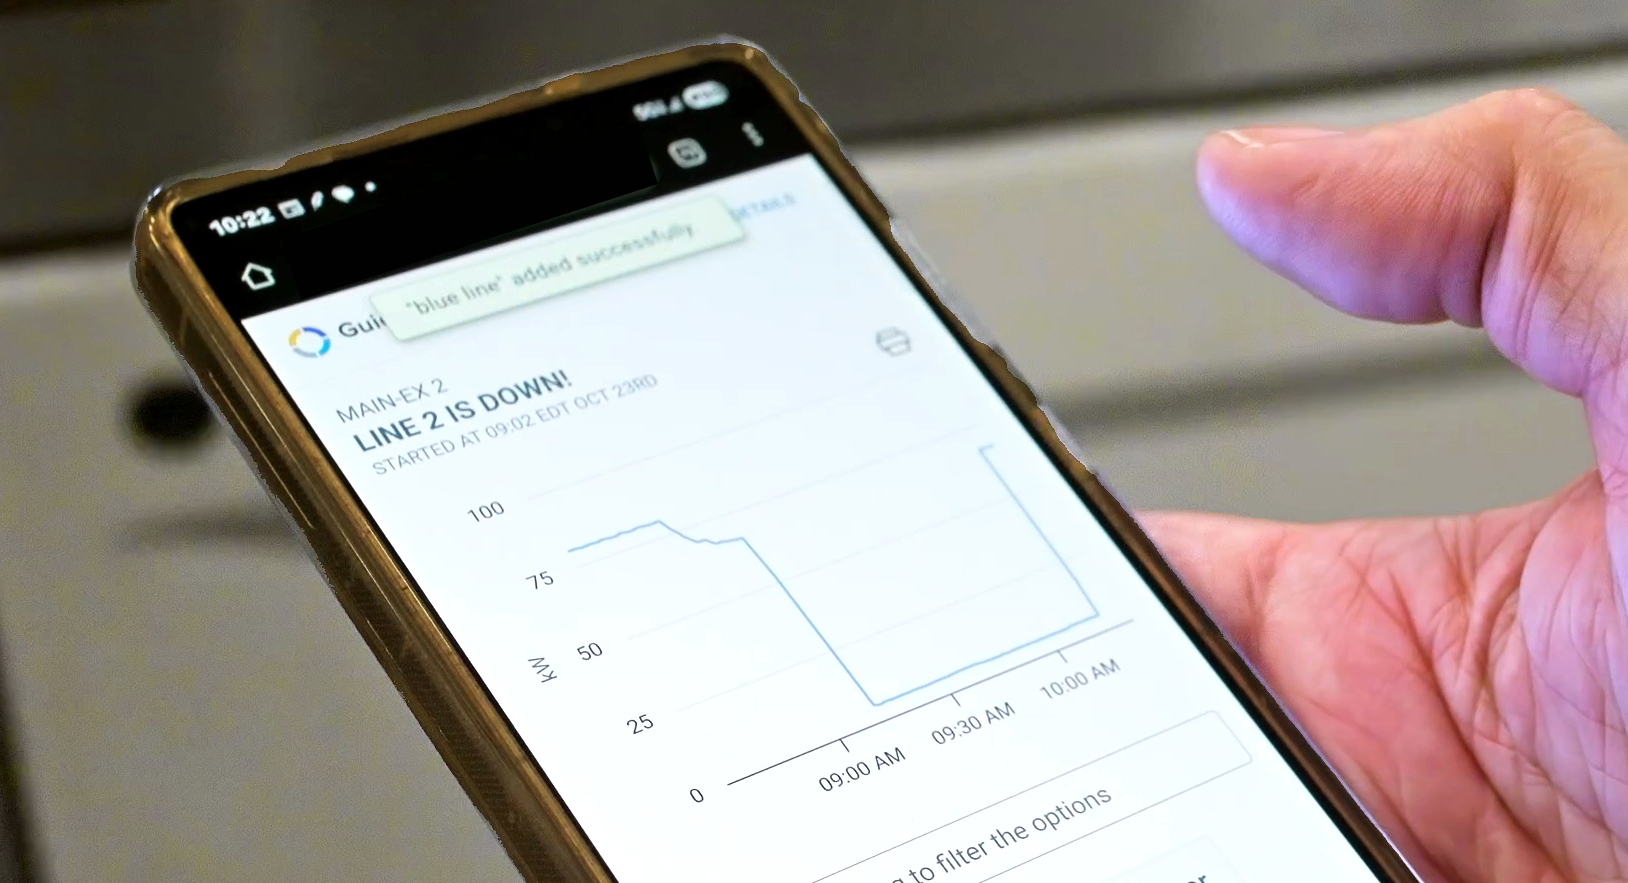
Respond faster to downtime
See downtime as it happens and send alerts to the people responsible for responding. With machine history and operator context in one view, your team can decide what to address before the next shift report.
Focus on your most costly issues
Zero in on your top downtime drivers by machine, shift, or issue type, and direct resources where they’ll have the biggest impact.
Recover hidden downtime
Identify and eliminate costly delays like slow changeovers, late starts, and microstops, that add up over time.
Build on the data as your needs grow
Start with a shared view of downtime. Add supported anomaly detection, condition monitoring and integrations as your team confirms the signals and workflows it needs.


92% uptime achieved annually at Fibrix
Real-time visibility into downtime and machine performance through Guidewheel helped the Fibrix team resolve key issues, align their teams, and achieve over 90% uptime for an entire year on their most critical line.

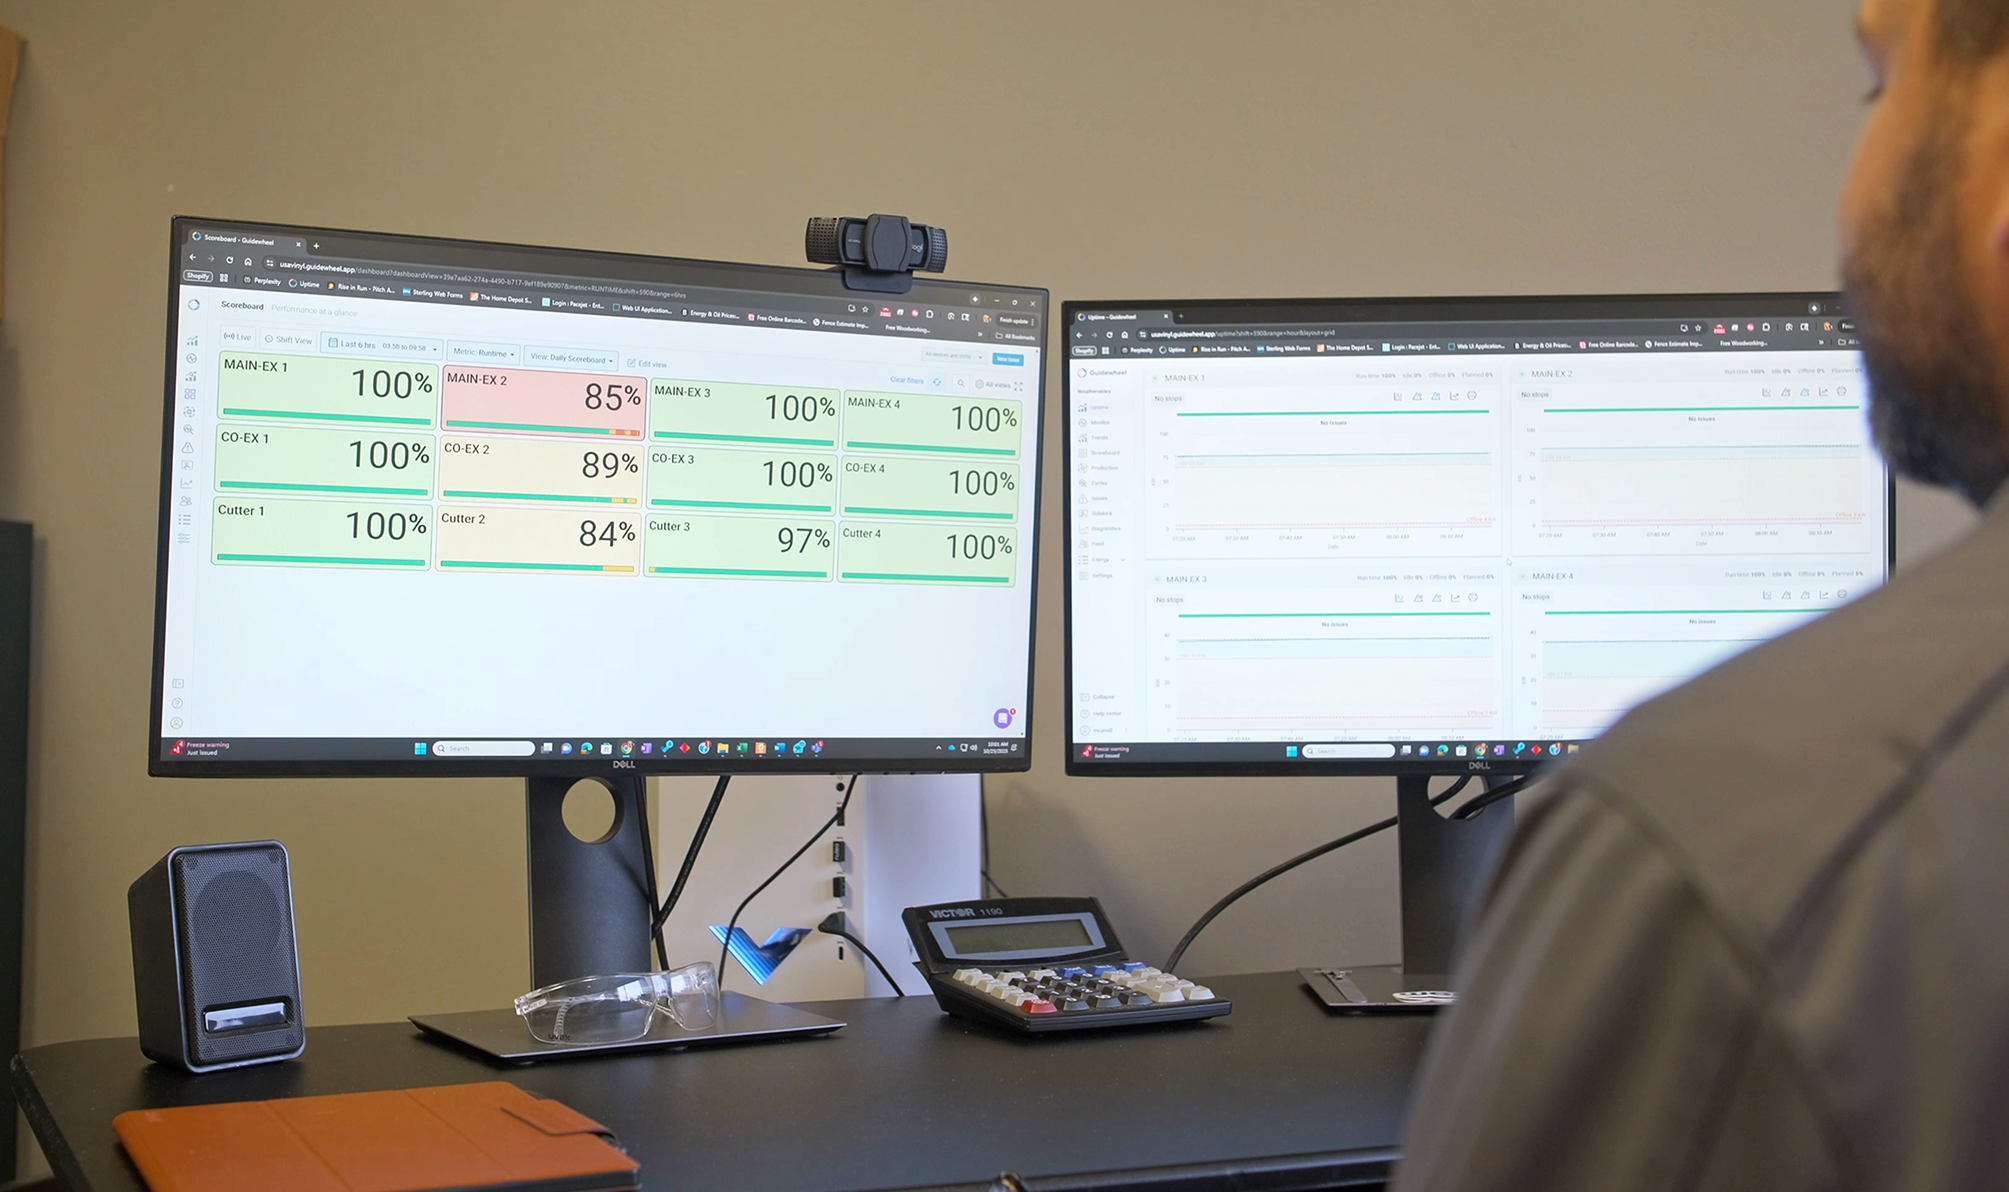
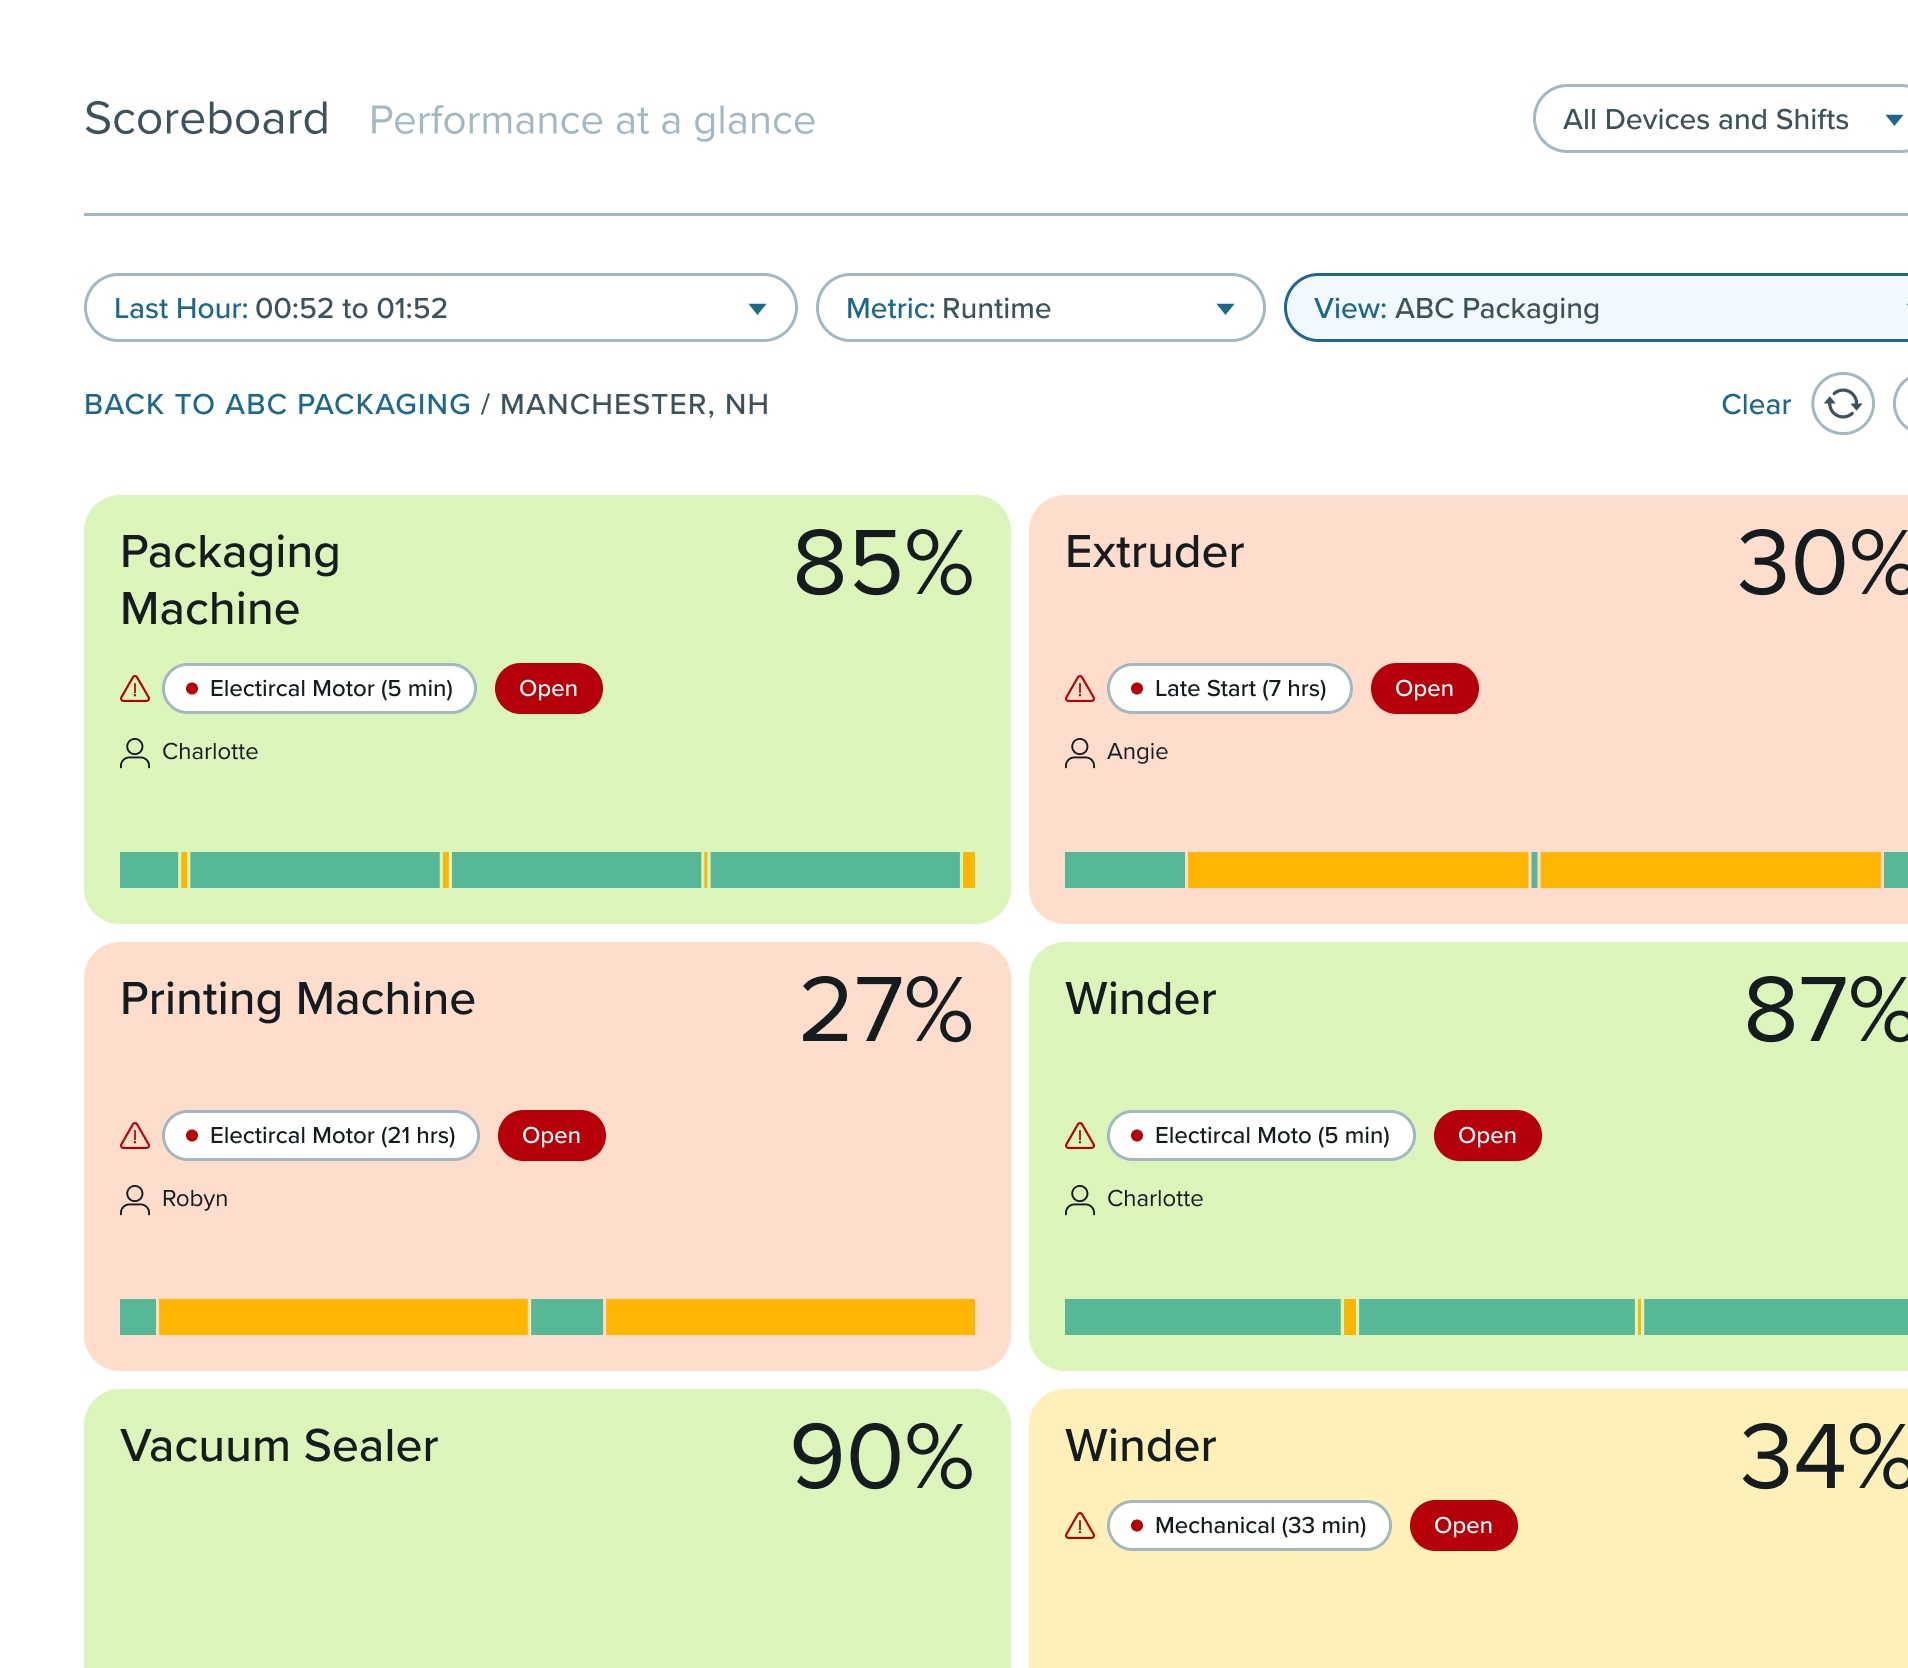
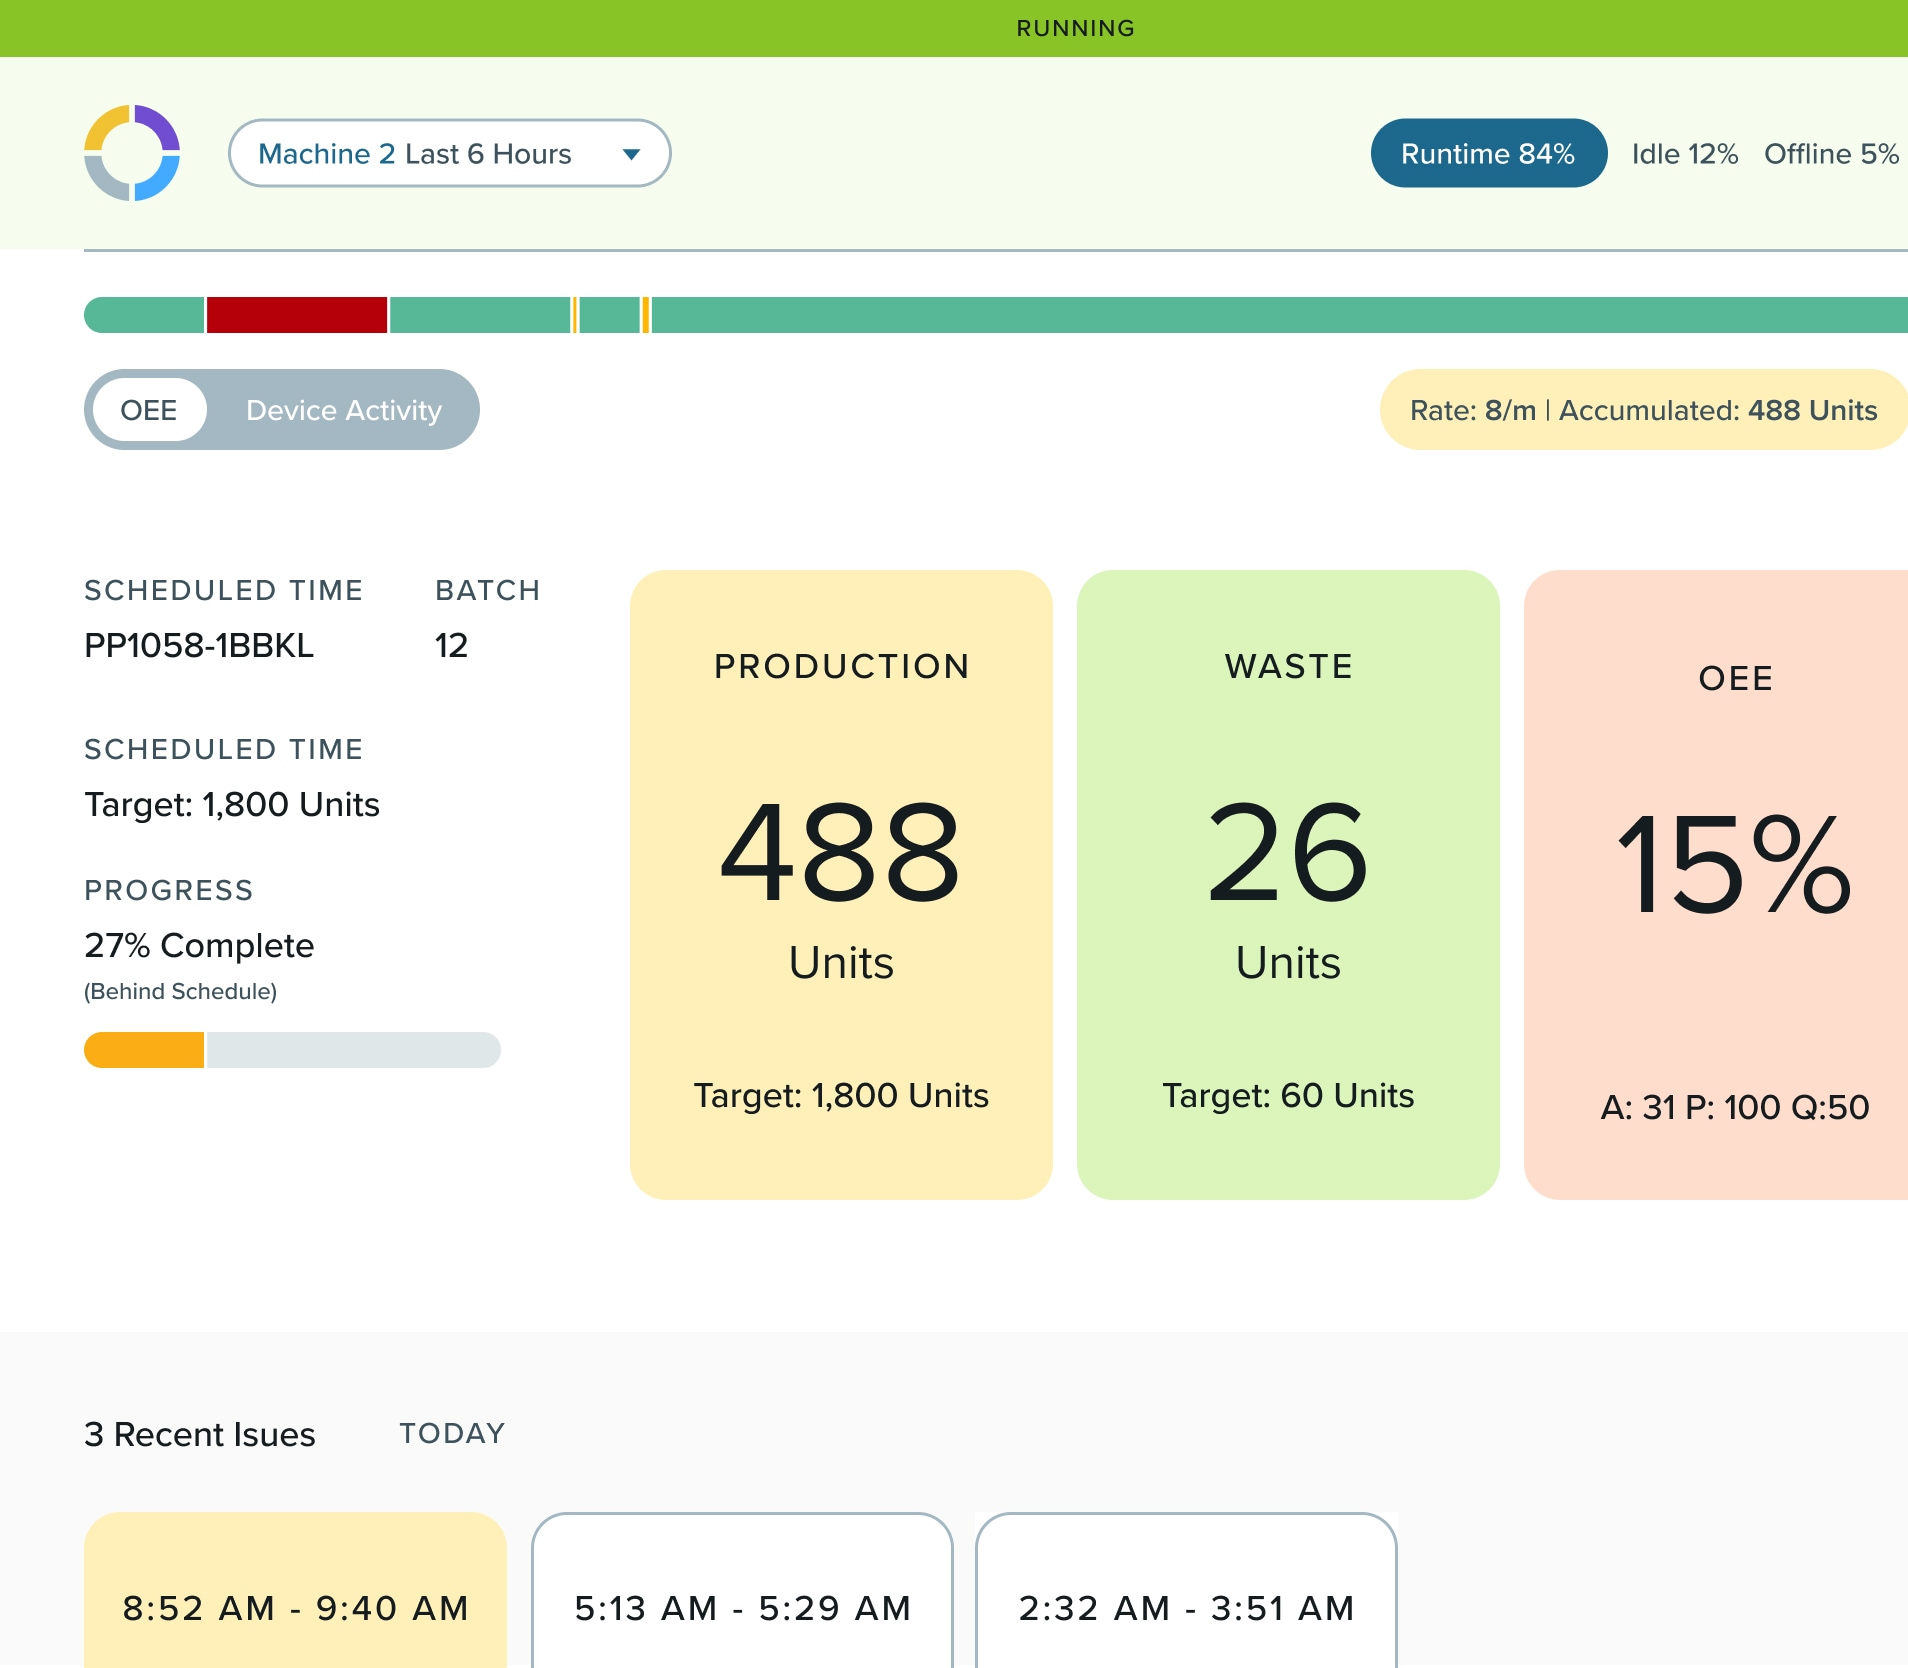
Scoreboards
See every line, shift and site on one scoreboard. Your teams stay aligned and act fast, and leaders get one shared record to decide where to add shifts, move work between plants or hold off on capex.
- Live dashboards with views at the machine and plant level
- Updates in real time across all shifts
- Display key metrics like runtime, OEE, and more
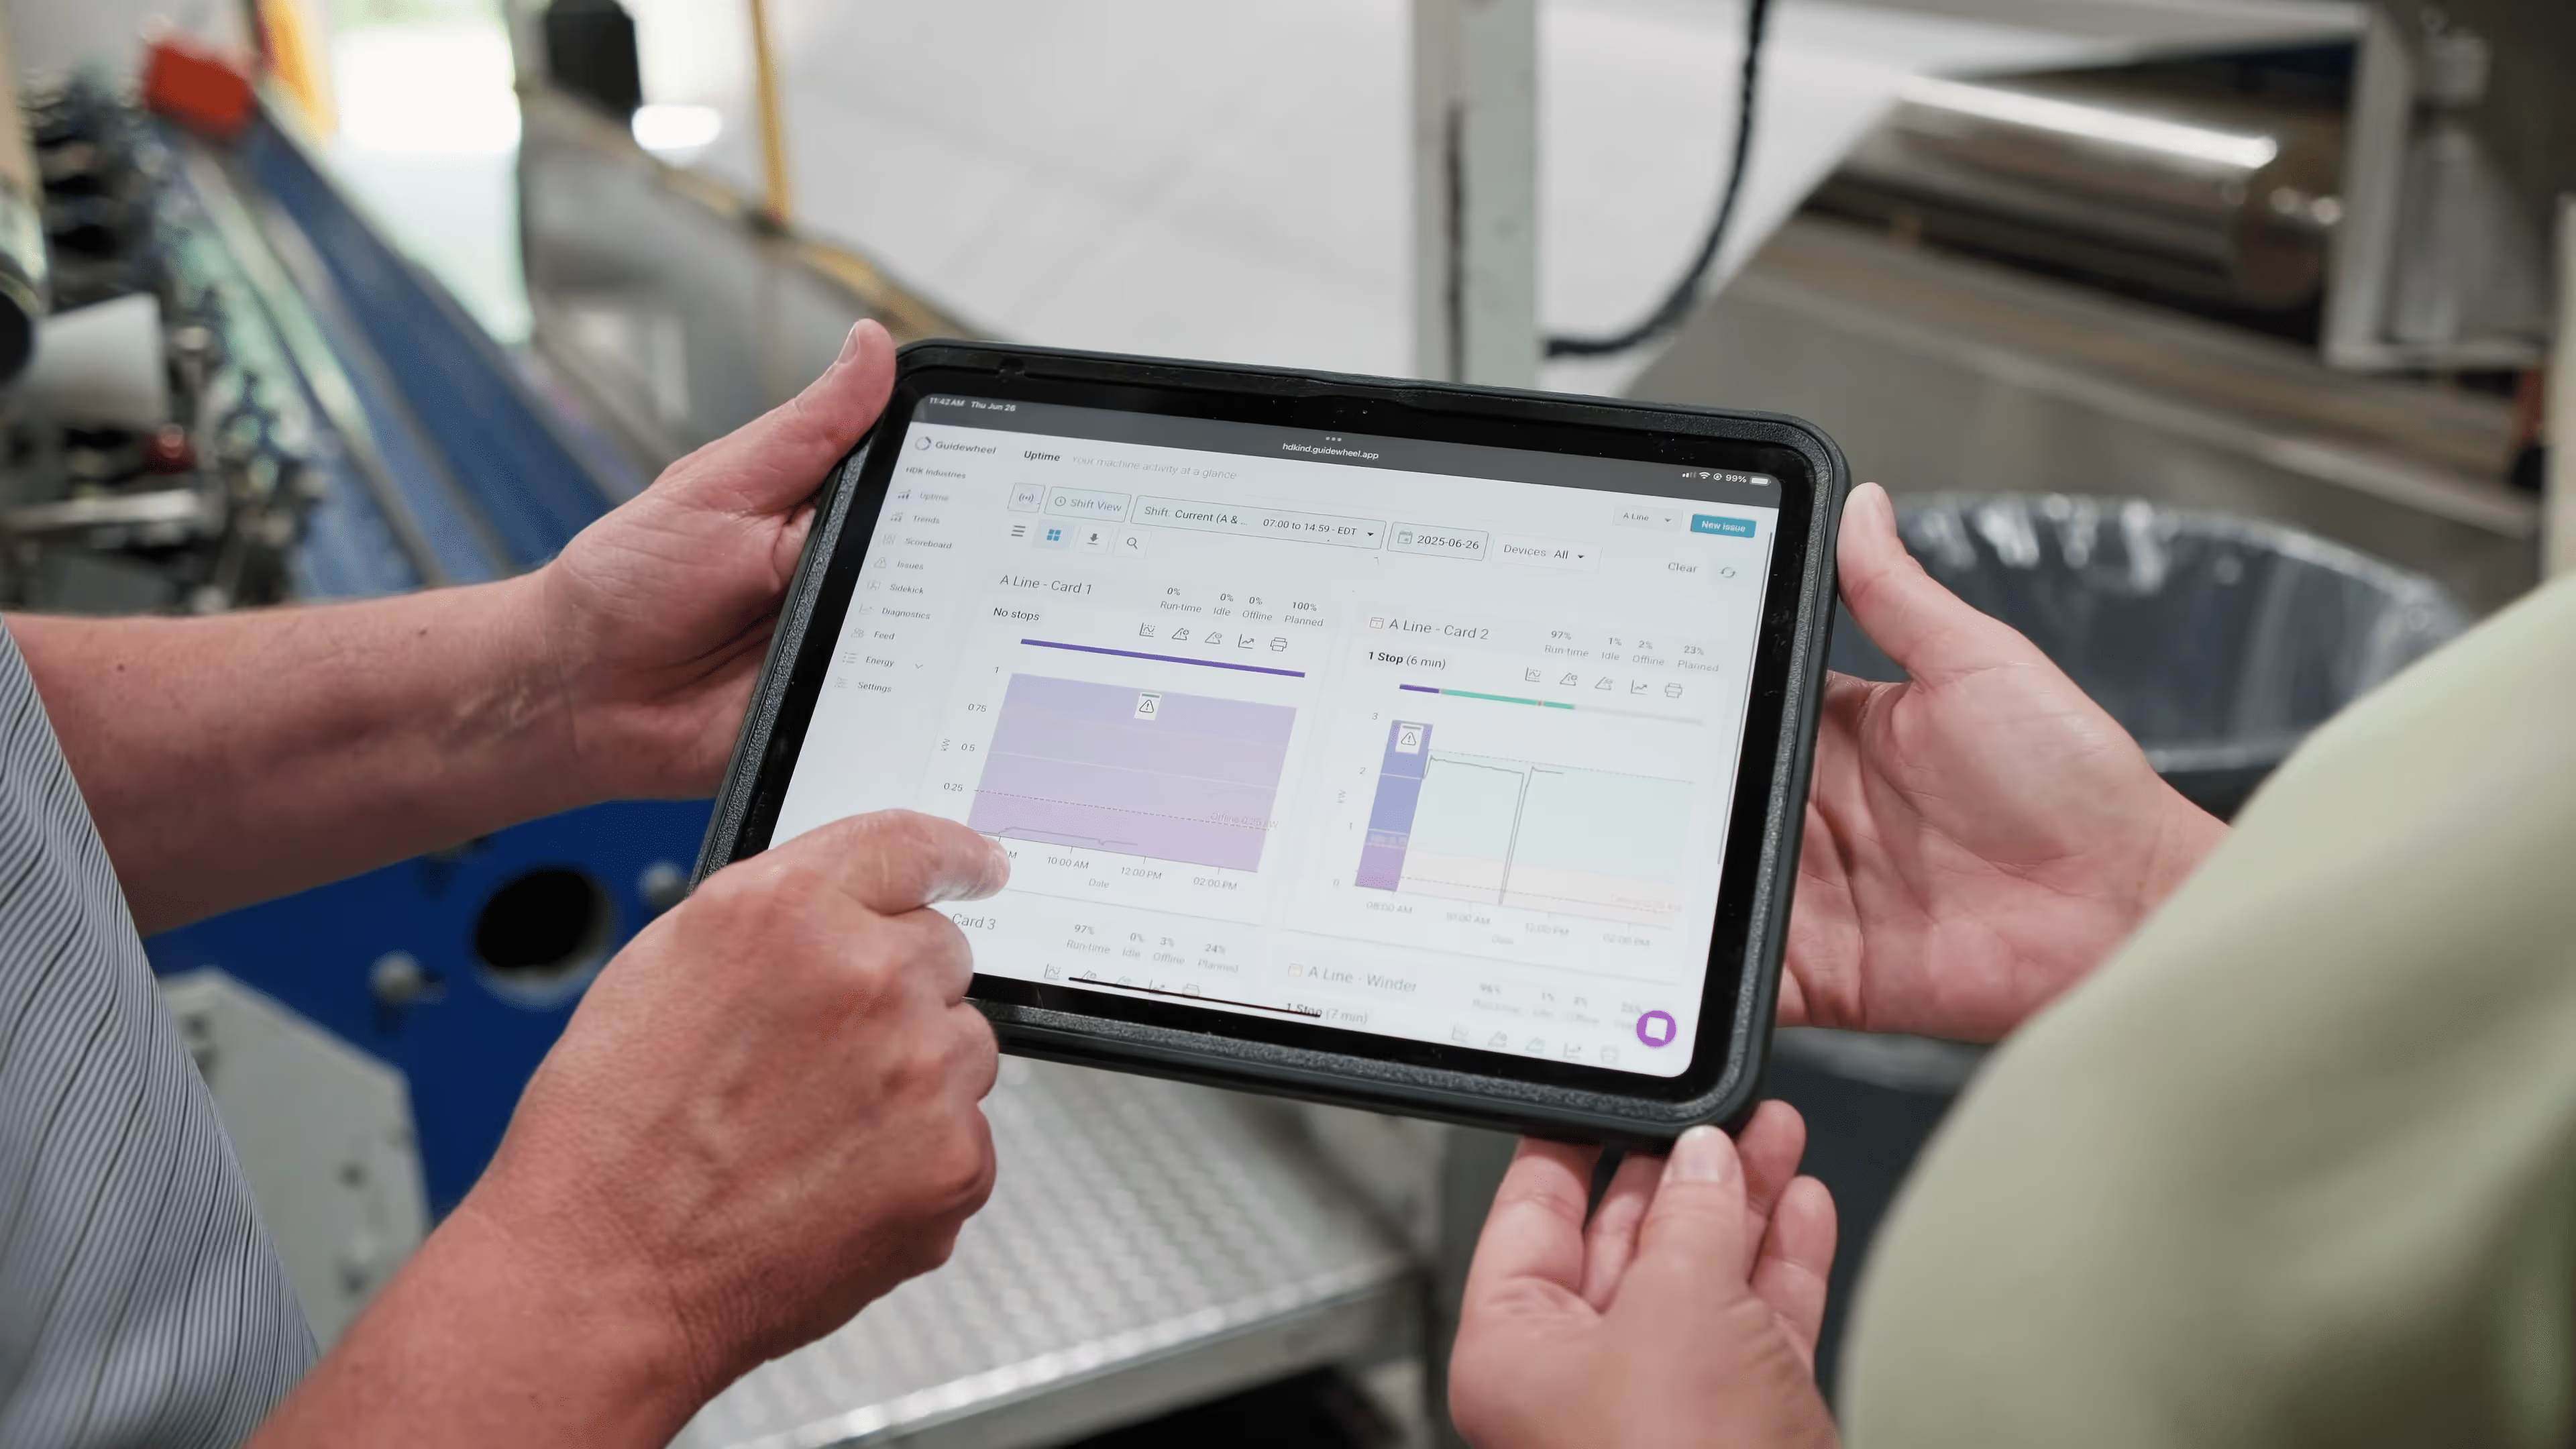
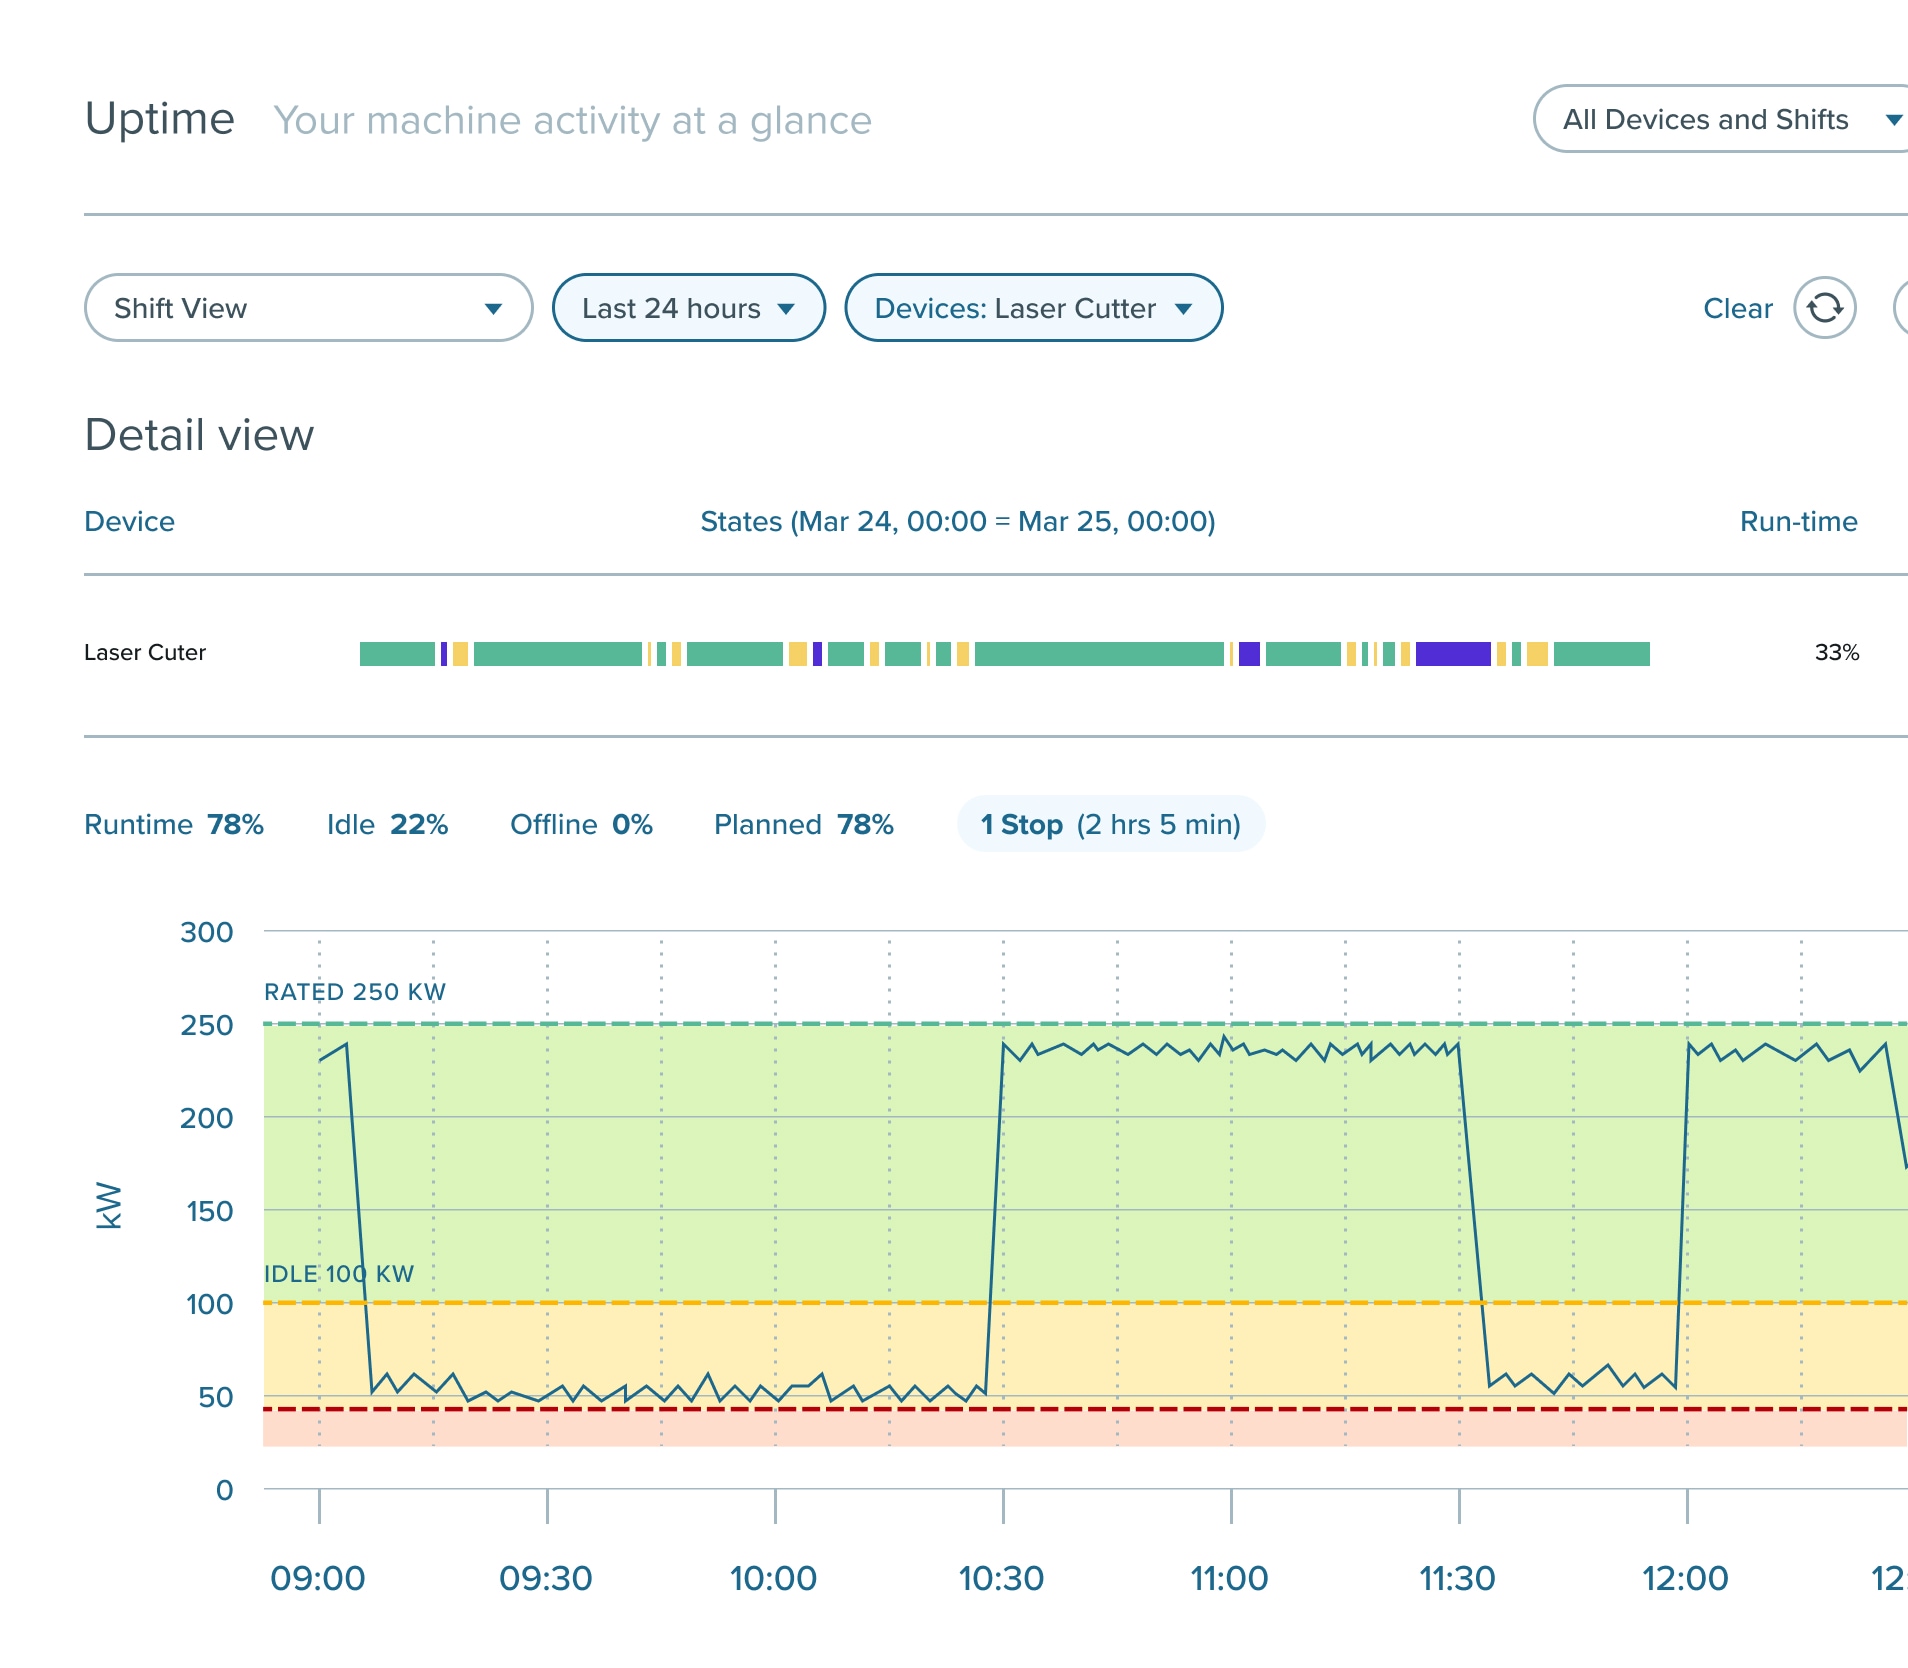
Uptime View
Monitor whether machines are running, idle, or down, and why. With real-time visibility into runtime, your teams can jump on issues before they impact production.
- See live machine status from any device
- See stop duration alongside the reasons your team records
- Spot and resolve issues as they happen
Mobile Alerts
Notify the right people when a configured downtime or anomaly alert needs their attention, including when they are away from the line.
- Monitor downtime and supported performance signals in real time
- Notify the people responsible for responding
- Keep output steady across every shift

Operator Dashboard
Give operators the tools to flag downtime, log issues, and keep lines moving in real time.
- Tag downtime events and request maintenance support in just a few taps
- Record scrap reasons without slowing down production
- Feed real-time insights from the floor directly into your team’s decision-making
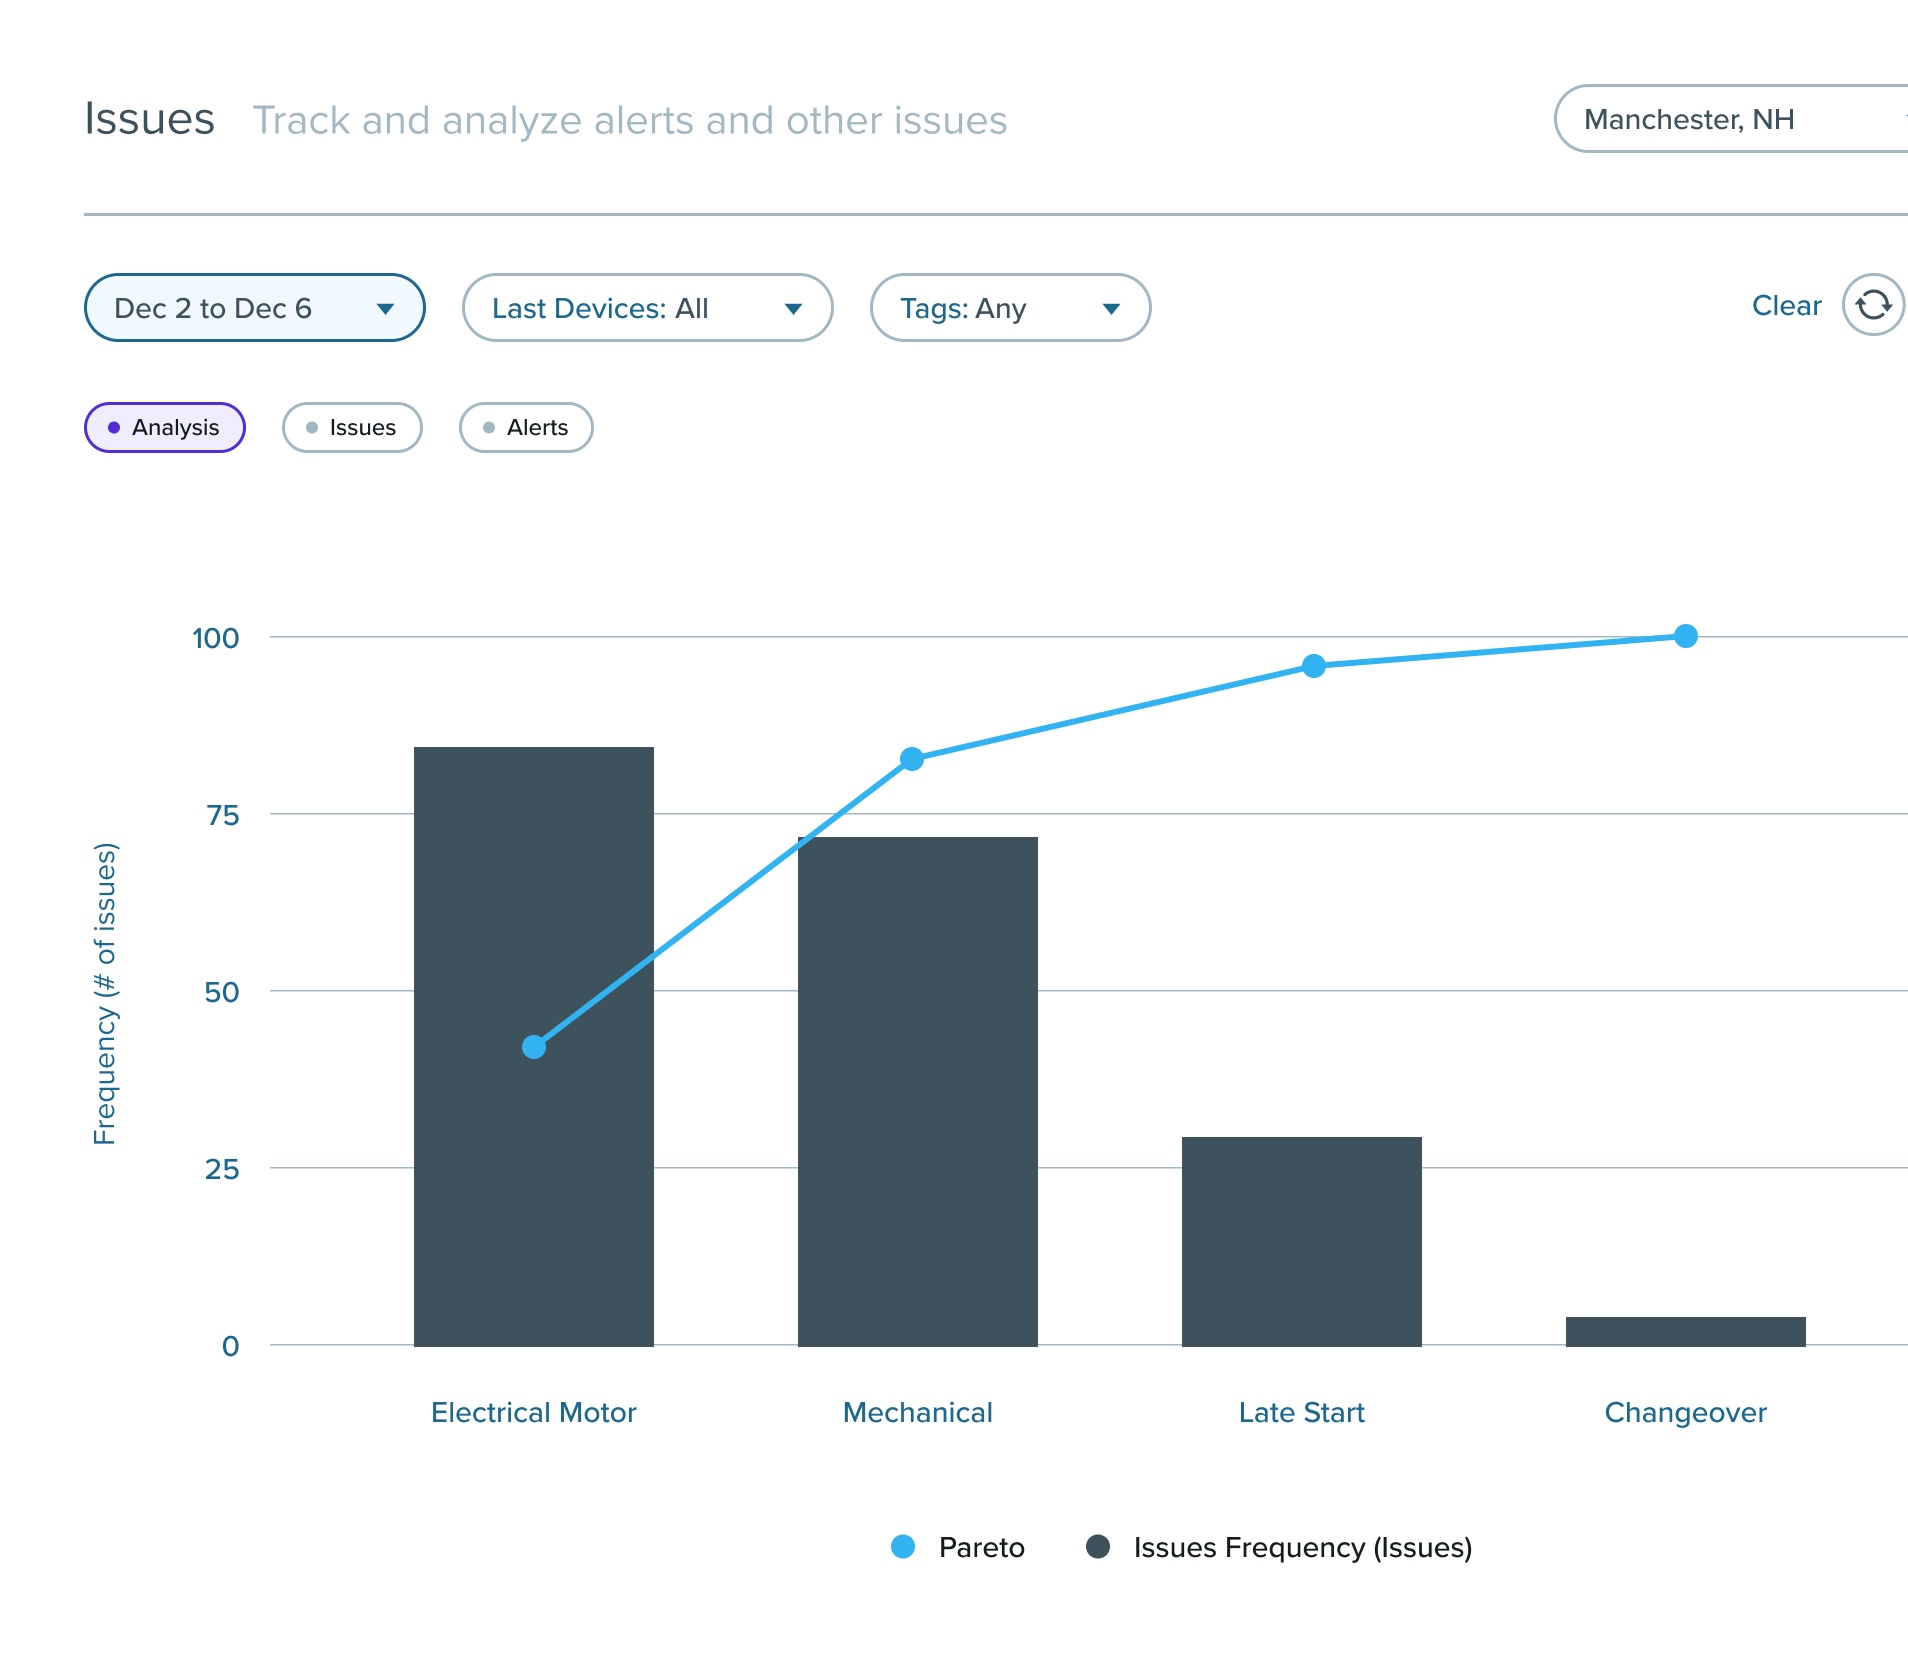
Pareto Analysis
Pinpoint and address your biggest downtime drivers to focus resources where they’ll have the most impact.
- Identify top downtime drivers by machine or type
- See which problems are costing you the most time
- Prioritize improvements based on data, not assumptions
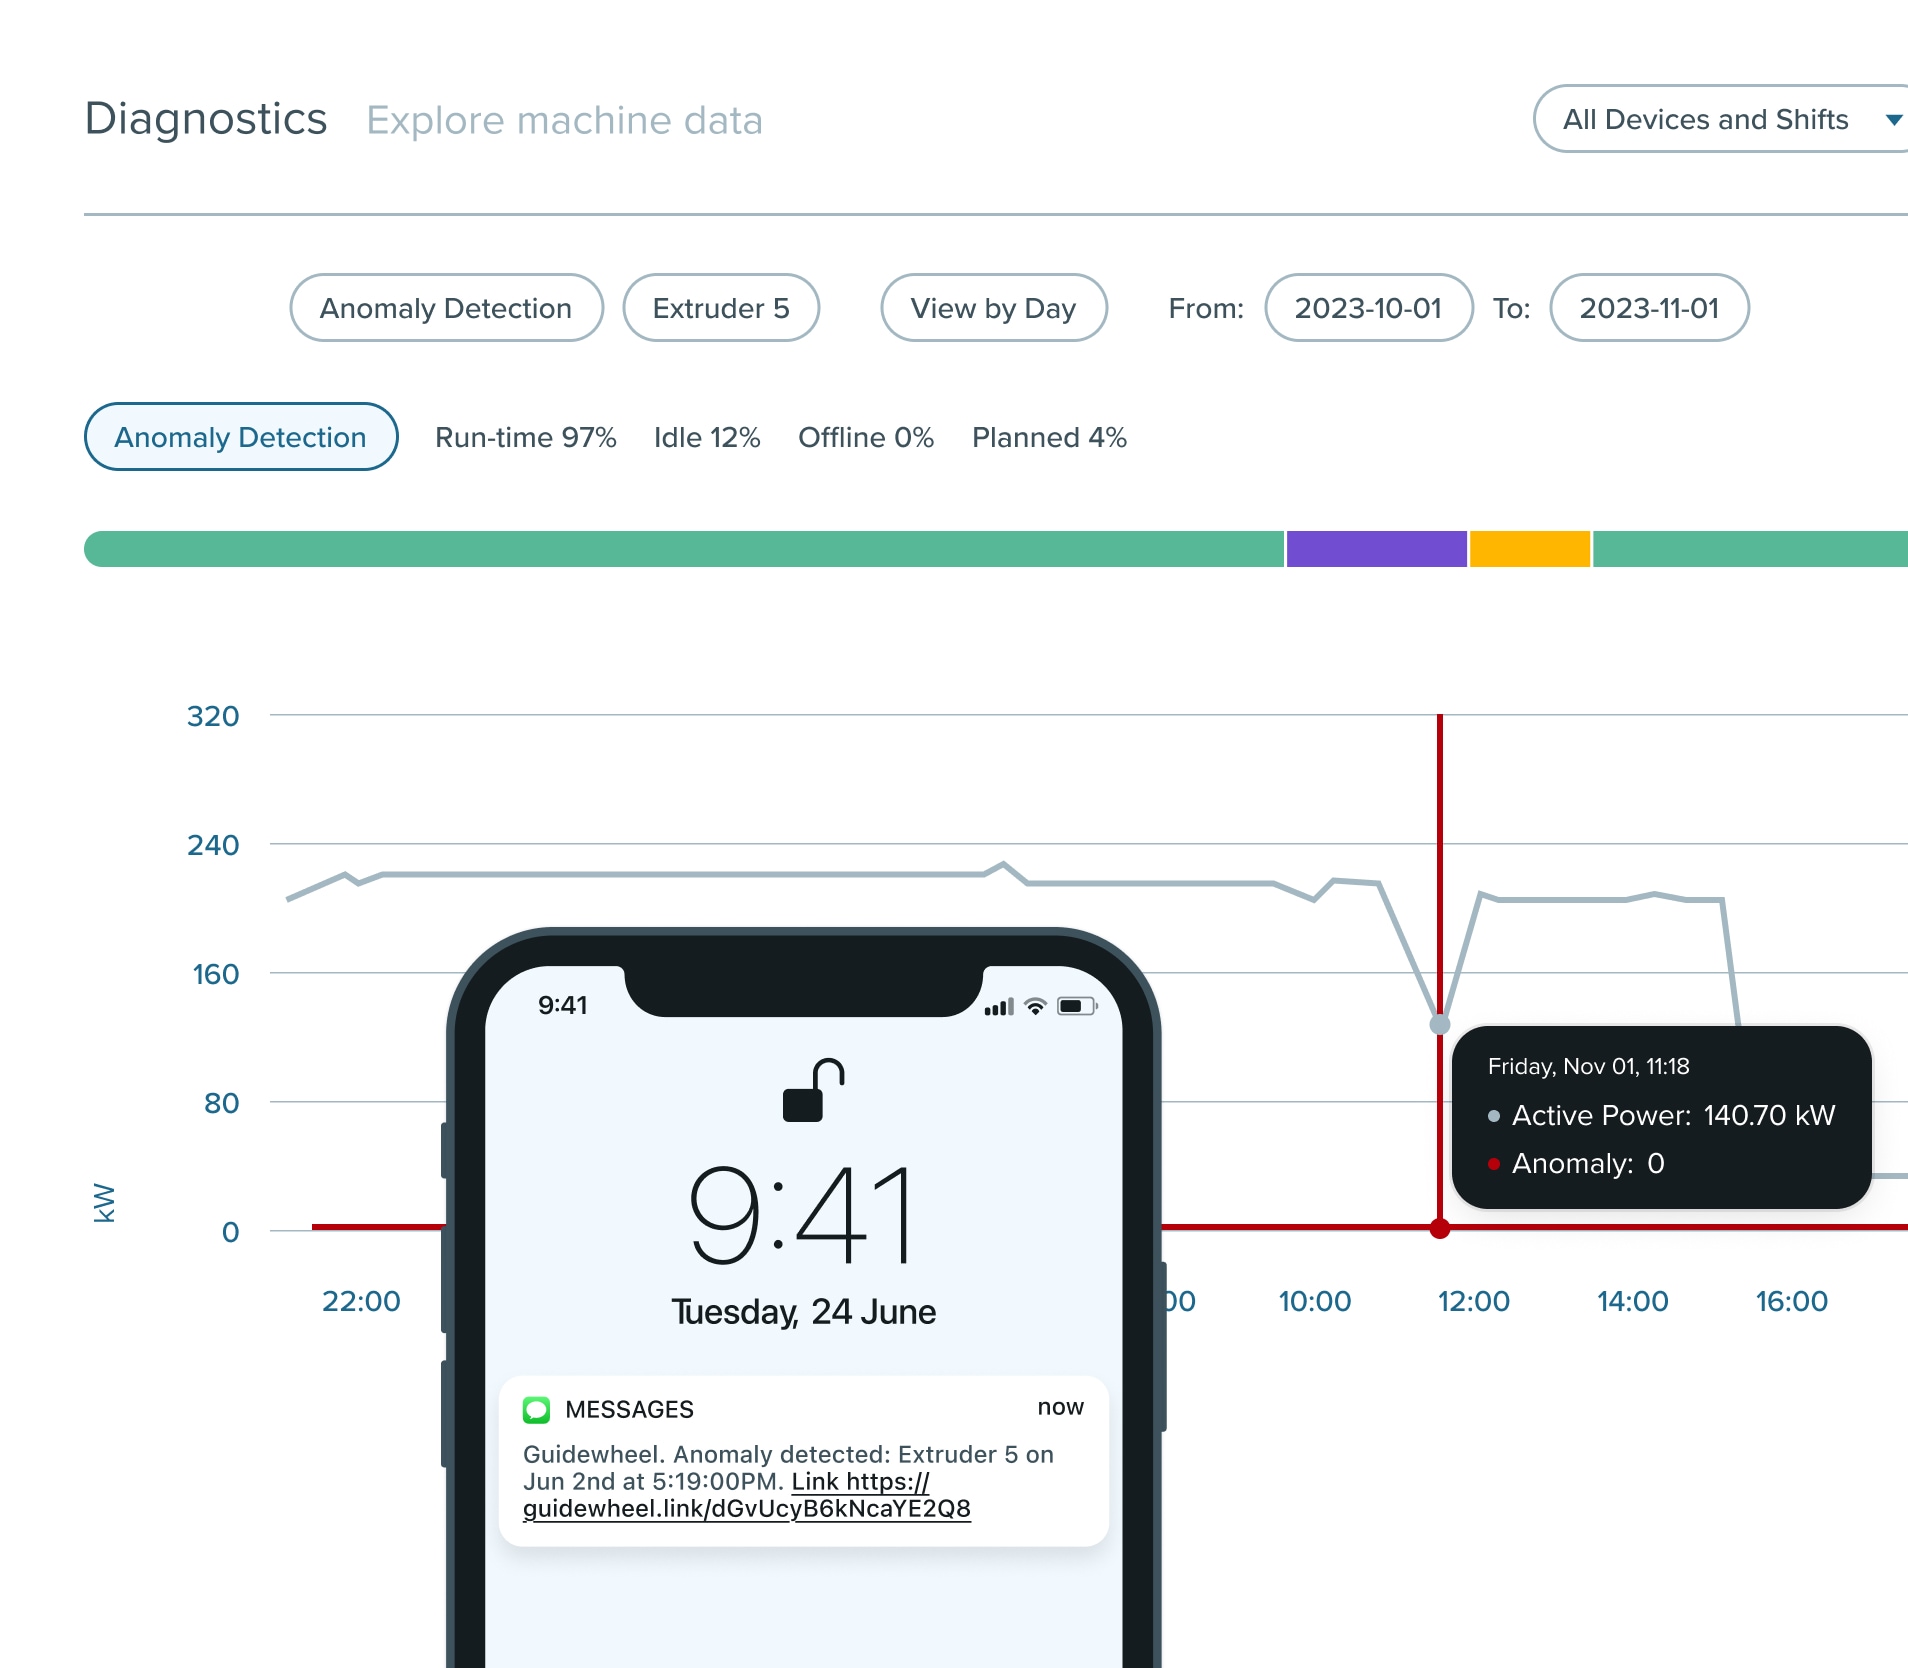
AI-Powered Anomaly Detection
Spot abnormal machine behavior early, so your team can address it before it turns into an unplanned stop.
- Flag deviations in supported machine signals
- Surface potential issues that manual checks may miss
- Investigate the signal and agree on an appropriate response

Frequently Asked Questions
Sensors measure machine power usage to help determine run, idle and down states. After the states and alert rules are configured, your team can see stops and receive notifications when attention is needed.
Yes. Operators or supervisors can tag downtime reasons with just a click, and reports surface trends over time so you know what’s driving losses.
Guidewheel supports machines across ages, makes and models using non-invasive sensing. Our team confirms the right sensor and validates how the signal represents run, idle and down for your equipment.
Installation can be quick. Timing depends on the machines, site access and configuration. Our team helps validate the first machine signals and build the daily review around them.
Ready to start reducing controllable downtime?
Learn how Guidewheel helps you catch issues early, take action fast, and keep your lines running smoothly.