No items found.
blog
Machine Monitoring Software: The 2026 Buyer's Guide
By: Guidewheel
Updated:
June 16, 2026
8 min read
If you're reading this, you probably already know you have a visibility problem on your shop floor. Maybe you're toggling between spreadsheets, shift notes, and whiteboard tallies trying to figure out why Line 3 keeps underperforming on second shift. Maybe you're running a mix of legacy equipment and newer CNCs, and nobody can give you a straight answer on actual machine utilization. You're not alone, and you're searching for the right machine monitoring software to fix it.
This buyer's guide gives you a clear way to evaluate your options. It covers what a machine monitoring system actually is, which KPIs matter, how to benchmark your uptime against real manufacturing data, and what to look for before you sign a contract. Let's get practical.
Key terms before we dive in
Before evaluating any manufacturing monitoring software, it helps to speak the same language. Here's a quick reference:
Term |
What it means in practice |
|---|---|
Machine monitoring system |
The full stack: sensors, connectivity, data processing, and dashboards that track machine run/idle/down states |
Machine monitoring software |
The application layer you interact with: dashboards, alerts, reports, downtime categorization |
Machine monitoring dashboard |
The visual display showing KPIs like uptime, OEE, cycle time, and production counts by role |
Machine monitoring platform |
An extensible, scalable foundation supporting multiple sites, integrations (ERP, CMMS, MES), and analytics workloads |
Production monitoring software |
Broadens focus from individual machines to line-level output, schedule adherence, and throughput tracking |
Equipment monitoring system |
Encompasses asset health across production machines and supporting utilities like compressors, pumps, and HVAC |
OEE (Overall Equipment Effectiveness) |
Availability x Performance x Quality, expressed as a single percentage of productive capacity |
MTBF / MTTR |
Mean Time Between Failures and Mean Time to Repair, the two reliability metrics that drive maintenance priorities |
Understanding these distinctions matters because your actual need determines what you should buy. A single plant tracking five CNC machines needs different capabilities than a multi-site operation standardizing KPIs across 200 assets.
The problem: you're making decisions on stale data
Here's what this looks like in a lot of plants. You walk into a morning production meeting with yesterday's numbers, compiled from operator logs that were filled out from memory at the end of a busy shift. The data says you hit 82% uptime. But did you? Nobody captured the fifteen minutes Machine 7 sat idle waiting for material. Nobody logged the three micro-stops on the packaging line that added up to 40 minutes of lost output.
Spreadsheet-based tracking and periodic reporting create a version of reality that's always a little too optimistic, a little too vague, and always delivered too late to act on. You end up chasing problems that already resolved themselves while chronic issues hide in plain sight.
The shift from periodic reporting to continuous, real-time machine monitoring is what separates plants that improve steadily from plants that stay stuck in reactive mode. When you can see machine state transitions as they happen, you catch problems in minutes instead of discovering them in next week's report.
How modern monitoring works on legacy equipment
One of the most common questions I hear: "How do I choose machine monitoring software for legacy equipment that has no digital interface?"
The good news: it's usually simpler than people think. You don't need to rip out your existing controls or wire into your PLC. Current transformers, small devices that clamp around a machine's power leads, can detect whether a motor or spindle is drawing current. That signal tells you if the machine is running, idle, or stopped. No PLC integration required.
For machines with PLCs or newer CNCs that support protocols like OPC UA or MTConnect, industrial gateways can pull richer data: spindle loads, feed rates, fault codes, and program identifiers. The key principle is to use the simplest reliable method for each machine.
✅
When evaluating machine monitoring for mixed fleets, prioritize platforms that use non-invasive sensing methods like clip-on current transformers. These work on any machine drawing electrical current — from decades-old hydraulic presses to modern CNCs — without requiring PLC access or control system modifications. This eliminates a major integration risk and lets you deploy across your entire fleet using a single, consistent approach, regardless of machine age or manufacturer.
Guidewheel's FactoryOps platform builds on this approach with clip-on current sensors that read electrical current on everything from decades-old presses to brand-new packaging lines. The sensors feed data through cellular connections — no plant Wi-Fi required — so even plants with limited network infrastructure can get up and running. But the real value isn't the sensor itself; it's how the platform turns raw current signatures into clear, real-time visibility your team can act on — converting a simple electrical signal into what the team calls a machine's "heartbeat."
This matters because most manufacturers run mixed fleets. You need a machine monitoring platform that handles your 1990s hydraulic press and your 2024 CNC machining center within the same dashboard, without two separate integration projects.
What "good" uptime actually looks like
This is the question everyone asks: what should my uptime be? The honest answer is that it depends on your industry, product mix, and operational context. But benchmarks help you calibrate.
Analysis from Guidewheel's performance dataset (covering 3,000+ machines and over 74 million machine-minutes) reveals something important: the way you measure uptime changes the answer dramatically.
Source: Guidewheel Performance Analysis.
![]()
The chart above shows how high-volume machines skew aggregate numbers. In Plastics, Packaging & Containers, the median machine runs about 26% of the time, but volume-weighted runtime jumps to 60%. Pharmaceuticals shows an even wider gap: 1% median versus 44% weighted average.
What does this mean for you? If you're benchmarking against industry averages without accounting for volume, you may be comparing your workhorse machines against a fleet that includes dozens of lightly used assets. Top-quartile runtime across all industries sits around 63%, which serves as a useful reference point, but your targets should be adapted to your specific equipment, shift patterns, and demand profile (Source: Guidewheel Performance Analysis).
The most meaningful benchmarks are usually internal: comparing your own shifts, lines, and plants against each other using the same production monitoring software and consistent definitions.
Where your downtime hours are actually going
Knowing your uptime number is step one. Step two is understanding what's eating it. This is where machine monitoring solutions for manufacturing deliver immediate value, by categorizing downtime so you can attack the right problems.
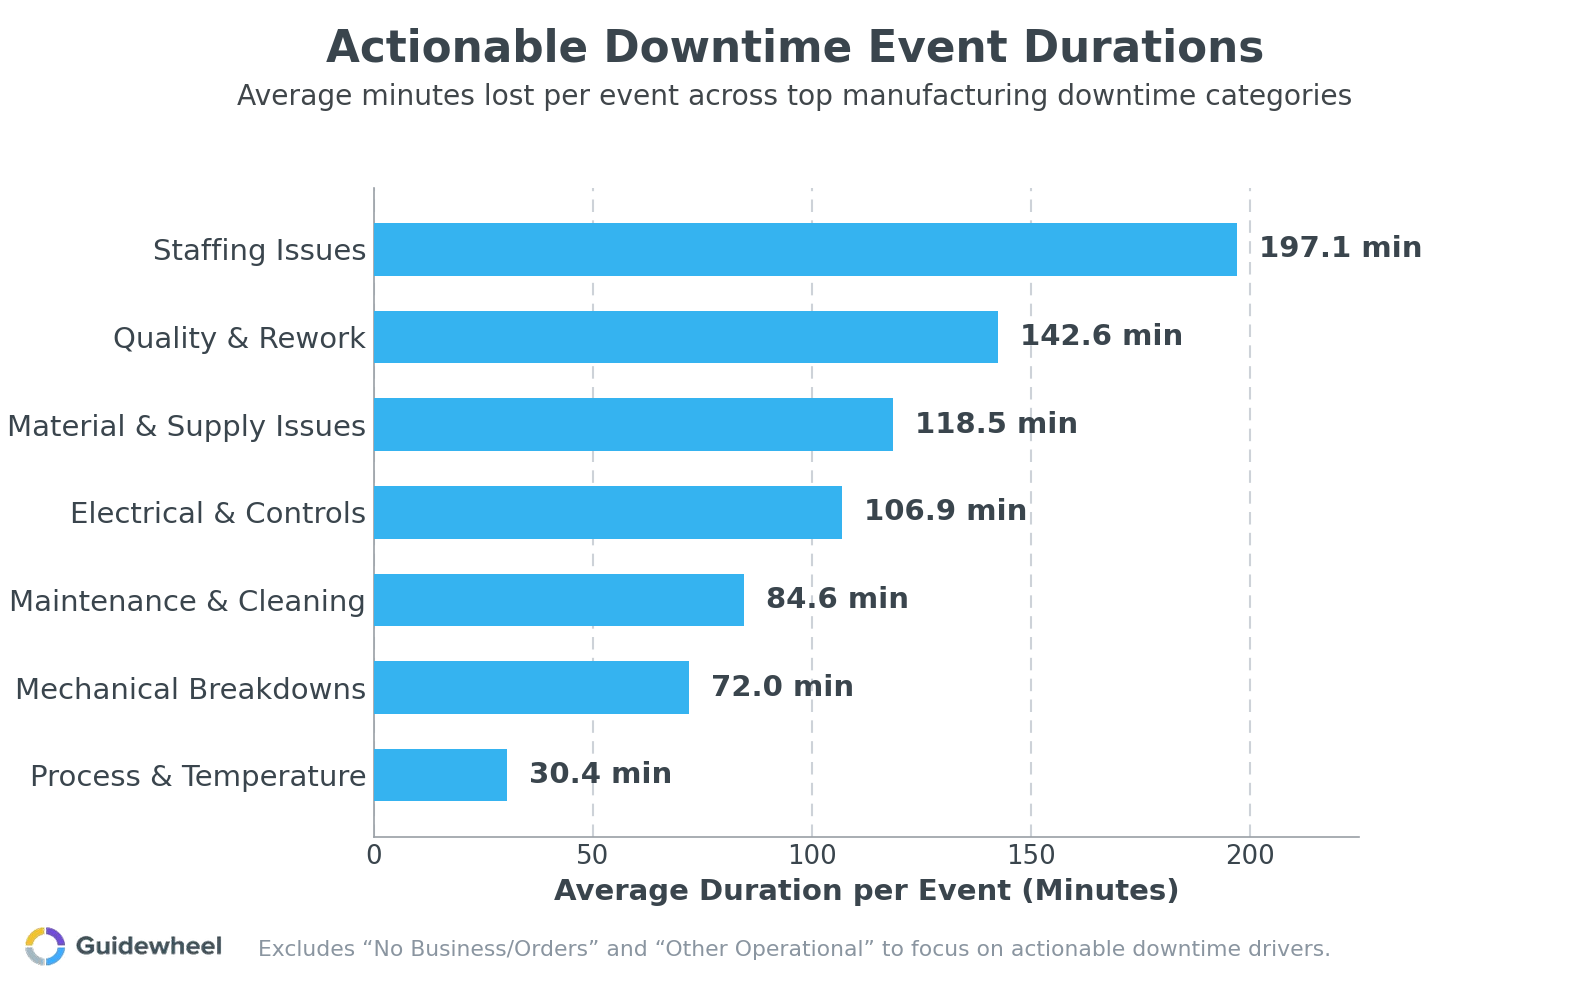
The data (Source: Guidewheel Performance Analysis) shows that the categories where plant teams can drive immediate improvement are the ones that follow:
Downtime category |
Avg. duration per event |
% of total downtime |
Why it matters |
|---|---|---|---|
Staffing issues |
197 min |
13% |
Second-longest events; scheduling and remote monitoring tools help close gaps |
Material & supply |
119 min |
17% |
Frequent and costly; live alerts prevent machines from starving |
Mechanical breakdowns |
72 min |
20% |
Highest event frequency (~0.1 per shift); usage-based maintenance reduces recurrence |
Maintenance & cleaning |
85 min |
11% |
Semi-planned but variable; standardized procedures shrink duration |
Mechanical breakdowns alone account for 20% of all downtime across 11 industries. They're frequent, but their shorter average duration means they're highly correctable with better preventive maintenance triggered by actual runtime hours instead of calendar dates. Staffing-related stops, while less frequent, average over three hours each, making crew scheduling and remote monitoring capabilities critical for multi-shift operations.
The takeaway: the biggest single block of lost time may be outside your control, but most of the downtime you can act on is still on the floor and within your team's ability to reduce it. That's precisely where a machine monitoring dashboard with structured downtime categorization and Pareto analysis pays for itself fastest.
What to evaluate before you buy
When comparing best machine monitoring software options for your plant, here's a practical evaluation framework:
Criteria |
What to ask the vendor |
|---|---|
Deployment speed |
Can we get first data within days, not months? What does the pilot look like? |
Machine compatibility |
Does it work on legacy equipment without PLC access? How does it handle mixed fleets? |
Ease of use |
Can operators log downtime reasons in under 10 seconds? Will supervisors actually use the dashboards? |
Multi-site support |
Can we roll this out across plants with consistent KPI definitions and cross-site views? |
Integration |
Does it connect with our CMMS, ERP, or MES? Are APIs documented and accessible? |
Total cost of ownership |
What's the per-machine cost at pilot scale versus full deployment? Are there hidden integration fees? |
Alerting |
Can it send mobile alerts when a machine has been down past a threshold? |
Cellular/network flexibility |
Does it require robust plant Wi-Fi, or can it operate on cellular connections? |
Which platforms work without connecting to the PLC? Guidewheel's FactoryOps platform uses non-invasive current sensing to monitor any machine by reading its electrical signature — no PLC access required. This means you don't need to touch your control system, which eliminates a major integration risk.
How much does machine monitoring software cost per machine? Pricing varies widely, from subscription models charging per machine per month to enterprise licenses. For budgeting, ask vendors to model costs at your pilot scale (say, 5–10 machines) and at full deployment (50–200+ machines). The pricing curve matters as much as the starting price.
Your 90-day implementation playbook
You don't need a massive IT project. Here's a phased approach that delivers value fast:
Weeks 1–2: Pilot scope. Pick 5–10 machines, ideally your bottleneck line and one or two chronic problem assets. Install sensors and validate data accuracy against manual counts.
Weeks 3–4: Baseline. Collect two weeks of clean data without making process changes. Establish your current uptime, top downtime causes, and changeover variability. (Guidewheel's performance data shows median changeover variability of 57% shift to shift, so don't be surprised if yours is high.)
Weeks 5–8: Act on the data. Run daily 15-minute standups using your real-time machine monitoring dashboard. Target the top two downtime categories from your Pareto chart. Adjust preventive maintenance triggers from calendar-based to usage-based.
Weeks 9–12: Measure and expand. Compare post-intervention uptime to your baseline. Document wins. Build the business case for expanding to additional lines or sites.
This staged approach keeps risk low and lets you prove value before you scale. Every wave should deliver incremental, measurable gains.
Start seeing what your machines are telling you
The best machine monitoring software for a multi-plant manufacturer isn't the one with the most features on a spec sheet. It's the one your operators will actually use, your maintenance team will trust, and your leadership can point to when making capacity decisions. Look for fast deployment, universal machine compatibility, and a platform that turns raw signals into decisions your team can act on this shift, not next quarter.
We had our best month of the year, increasing production from 26k-35k/month to 46k cases in March. I attribute this to Guidewheel. Being able to see downtime data and address downtime reasons directly correlates to higher production.
Michael Palmer, VP of Operations, Direct Pack
If you're ready to find out how much capacity is already sitting on your floor, Book a Demo and see what your factory is telling you in real time — starting with your toughest line.
💡
Frequently asked questions
What is a machine monitoring system, and how is it different from machine monitoring software?
A machine monitoring system is the complete stack: sensors on machines, communication hardware (gateways), data storage, and the application you interact with. Machine monitoring software refers specifically to the application layer, the dashboards, alerts, reports, and analytics tools. Think of the system as the whole package and the software as the interface your team uses daily. When evaluating vendors, make sure you understand whether they provide the full system or just software that requires you to source your own hardware and connectivity.
How does real-time machine monitoring improve uptime and reduce downtime?
It shortens the gap between when a problem occurs and when someone acts on it. Instead of discovering that a machine sat idle for 45 minutes during a shift handover review, your supervisor gets an alert within seconds. Over time, structured downtime categorization reveals patterns: maybe the same machine trips every Tuesday afternoon, or changeovers on a specific product always run long. Those patterns become targeted improvement projects instead of vague complaints.
What KPIs should manufacturers track in a machine monitoring dashboard?
Start with availability (percentage of scheduled time the machine actually ran), OEE, MTBF, and MTTR. Add changeover duration and schedule adherence once your team is comfortable with the basics. For production-focused views, track actual output versus plan, scrap rates, and cycle time deviations. The key is matching KPIs to roles: operators need simple run/stop and target progress, supervisors need area overviews and bottleneck alerts, and plant managers need aggregated trends across lines and shifts.
How quickly can a plant deploy machine monitoring without disrupting production?
With non-invasive sensor approaches, initial installation on a pilot set of machines can happen in days with zero production disruption. Sensor clamps go around power leads during brief pauses, gateways connect via cellular or existing networks, and data typically starts flowing within hours of installation. A full baseline period of two to four weeks follows, during which you collect data without changing processes. Many plants see actionable insights within the first month.
How can monitoring data help standardize performance across shifts and plants?
When every shift and every plant reports from the same data source with the same metric definitions, you eliminate the "your numbers versus my numbers" problem. A multi-site machine monitoring platform lets you compare uptime, changeover consistency, and downtime causes across locations using identical calculations. That objectivity turns performance gaps into learning opportunities: if Plant B consistently runs shorter changeovers on similar equipment, Plant A can adopt those practices with data to back the conversation.
About the author
Lauren Dunford is the CEO and Co-Founder of Guidewheel, a FactoryOps platform that empowers factories to reach a sustainable peak of performance. A graduate of Stanford, she is a JOURNEY Fellow and World Economic Forum Tech Pioneer. Watch her TED Talk—the future isn't just coded, it's built.

