No items found.
blog
How to Reduce Downtime: The 2026 Playbook
By: Guidewheel
Updated:
June 11, 2026
8 min read

Every plant manager I talk to knows exactly where their biggest headaches live: the line that always seems to go down on second shift, the changeover that somehow takes 90 minutes one day and 45 the next, the recurring jam nobody can fully explain. The frustrating part isn't that manufacturing downtime exists. It's that most teams lack a trusted, shared picture of where time actually goes, which means improvement efforts often start with a debate instead of a decision.
Here's the good news: you don't need a multi-year digital transformation or a big capital project to start winning back hours. The playbook for reducing downtime in 2025 and beyond is built on a simpler idea: capture basic machine data from the equipment you already have, turn that data into a shared truth your whole team trusts, and then attack the biggest losses first with focused, fast-cycle improvements.
This guide walks through exactly how to do that, from definitions and root causes to benchmarks and a step-by-step framework you can start using this week.
Understanding the basics before you start
Before you jump into tactics, it helps to get clear on a few key terms. Misalignment on definitions is one of the fastest ways to derail a downtime reduction effort.
Term |
What it means in practice |
|---|---|
Downtime |
Any period during planned production time when equipment is not producing saleable output at the intended rate |
Planned downtime |
Scheduled stops built into the production plan: preventive maintenance, changeovers, sanitation, breaks |
Unplanned downtime |
All unscheduled stops that interrupt production: breakdowns, material shortages, quality holds, staffing gaps |
Availability |
Uptime divided by planned production time, expressed as a percentage |
Availability × Performance × Quality — the composite metric that captures all major production losses |
|
MTBF |
Mean Time Between Failures: total operating time divided by the number of failures |
MTTR |
Mean Time To Repair: total repair time divided by the number of repairs |
The critical distinction for any improvement effort is the split between planned vs. unplanned downtime. Both matter, but they require different strategies. Unplanned stops need reliability engineering and faster response. Planned stops need optimization: tighter changeovers, smarter PM scheduling, leaner cleaning routines.
Why downtime reduction deserves strategic attention now
If you're running a packaging line, a press cell, or an extrusion operation, you already feel the pressure: customers want shorter lead times, skilled labor is harder to find, and material costs keep moving. Buying more capacity through new equipment or extra shifts is expensive and slow. The faster path is extracting more productive hours from the machines you already own.
Here's a simple way to think about it: if your critical line runs eight hours of effective production in a ten-hour shift, recovering just one lost hour increases capacity by 12.5%, with zero capital spend. When you multiply that by contribution margin, the numbers get compelling fast.
✅
Downtime isn't just a maintenance problem — it cuts across the whole operation. A stop caused by missing labels reveals gaps in material staging, planning, or supplier reliability. When you treat downtime as a shared metric instead of a maintenance-only issue, you align teams around a common language of improvement. Internal benchmarking (comparing your own lines against each other) is often more actionable than chasing abstract "world-class" targets, because your top-performing lines already prove what's achievable with your equipment, products, and people.
Downtime cuts across the whole operation. A stop caused by missing labels isn't just a production problem; it reveals gaps in material staging, planning, or supplier reliability. When you treat downtime as a shared metric instead of a maintenance-only issue, you align teams around a common language of improvement.
The real causes of downtime in manufacturing
Ask five people on the floor why a line went down last shift, and you'll often get five different answers. That's the problem with relying on memory and manual logs. Recent performance data from Guidewheel's analysis of over 14,000 downtime events across 3,000+ machines shows a clearer picture of where time actually goes.
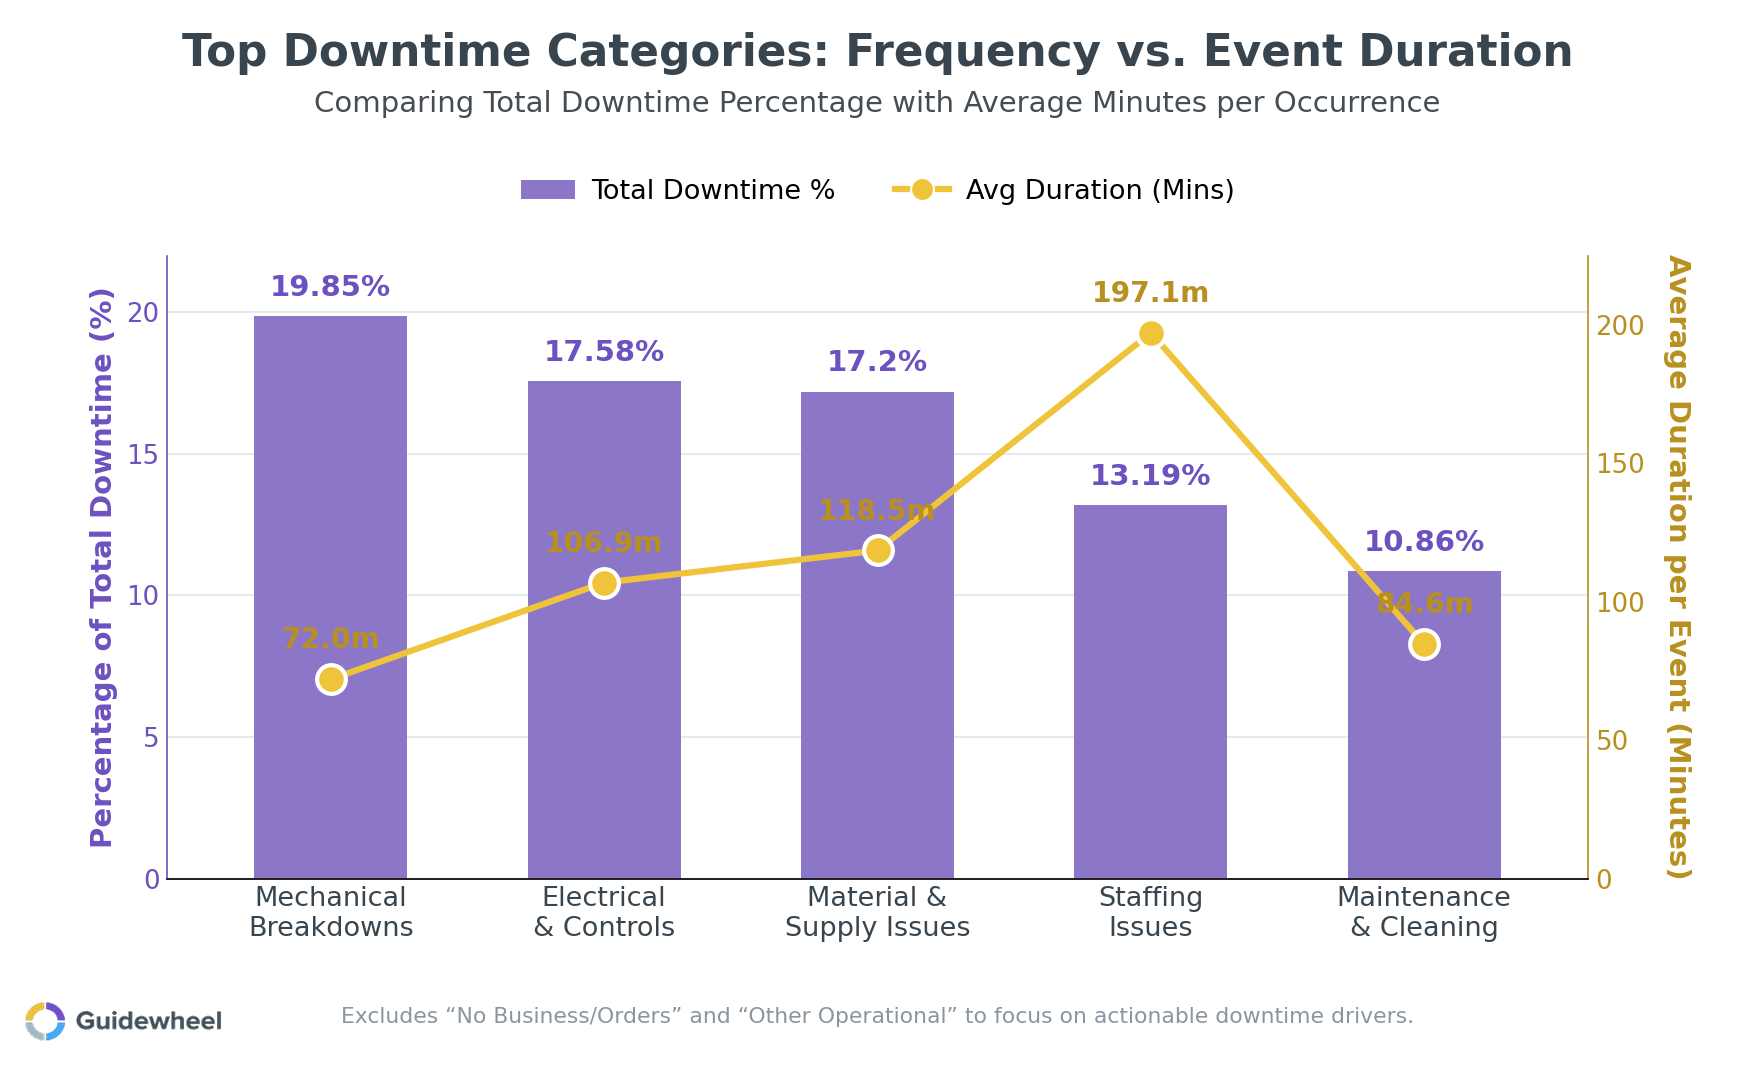
This chart reveals something that often surprises teams: the categories that account for the most total downtime aren't always the ones with the longest individual events. Here's what the data shows:
Downtime category |
% of total downtime |
Avg. duration per event |
Key insight |
|---|---|---|---|
Mechanical Breakdowns |
20% |
72 min |
High total share despite moderate event duration — consistent, recurring failures |
Electrical & Controls |
18% |
107 min |
Fewer events, but harder to resolve quickly |
Material & supply issues |
17% |
118 min |
Externally driven; resolution waits on upstream flow, so events run long |
Staffing Issues |
13% |
197 min |
Less frequent, but each event causes severe disruption |
Maintenance & Cleaning |
11% |
85 min |
Necessary but optimizable with better scheduling |
The critical takeaway: while demand-related gaps (no orders) may show up as the statistically largest single category, they're largely outside the plant's direct control. The categories listed above, operational issues, mechanical failures, electrical faults, staffing, and maintenance, are the ones your team can actually influence. Combined, they represent the vast majority of controllable lost time.
Each category calls for a different intervention. Mechanical breakdowns respond to better PM compliance and condition monitoring. Staffing-driven losses respond to cross-training and smarter shift planning. Electrical and controls issues often need focused troubleshooting and improved spare parts management. And that broad “other operational” bucket? It's a signal to refine your downtime reason codes so the data becomes more specific and actionable.
How to find your biggest loss: the benchmarking gap
One of the most practical things you can do is stop comparing yourself to abstract “world-class” targets and start comparing your own lines against each other. Internal benchmarking, lining up similar machines or shifts and asking “why is Line 3 consistently better than Line 7?”, is where the real wins hide.
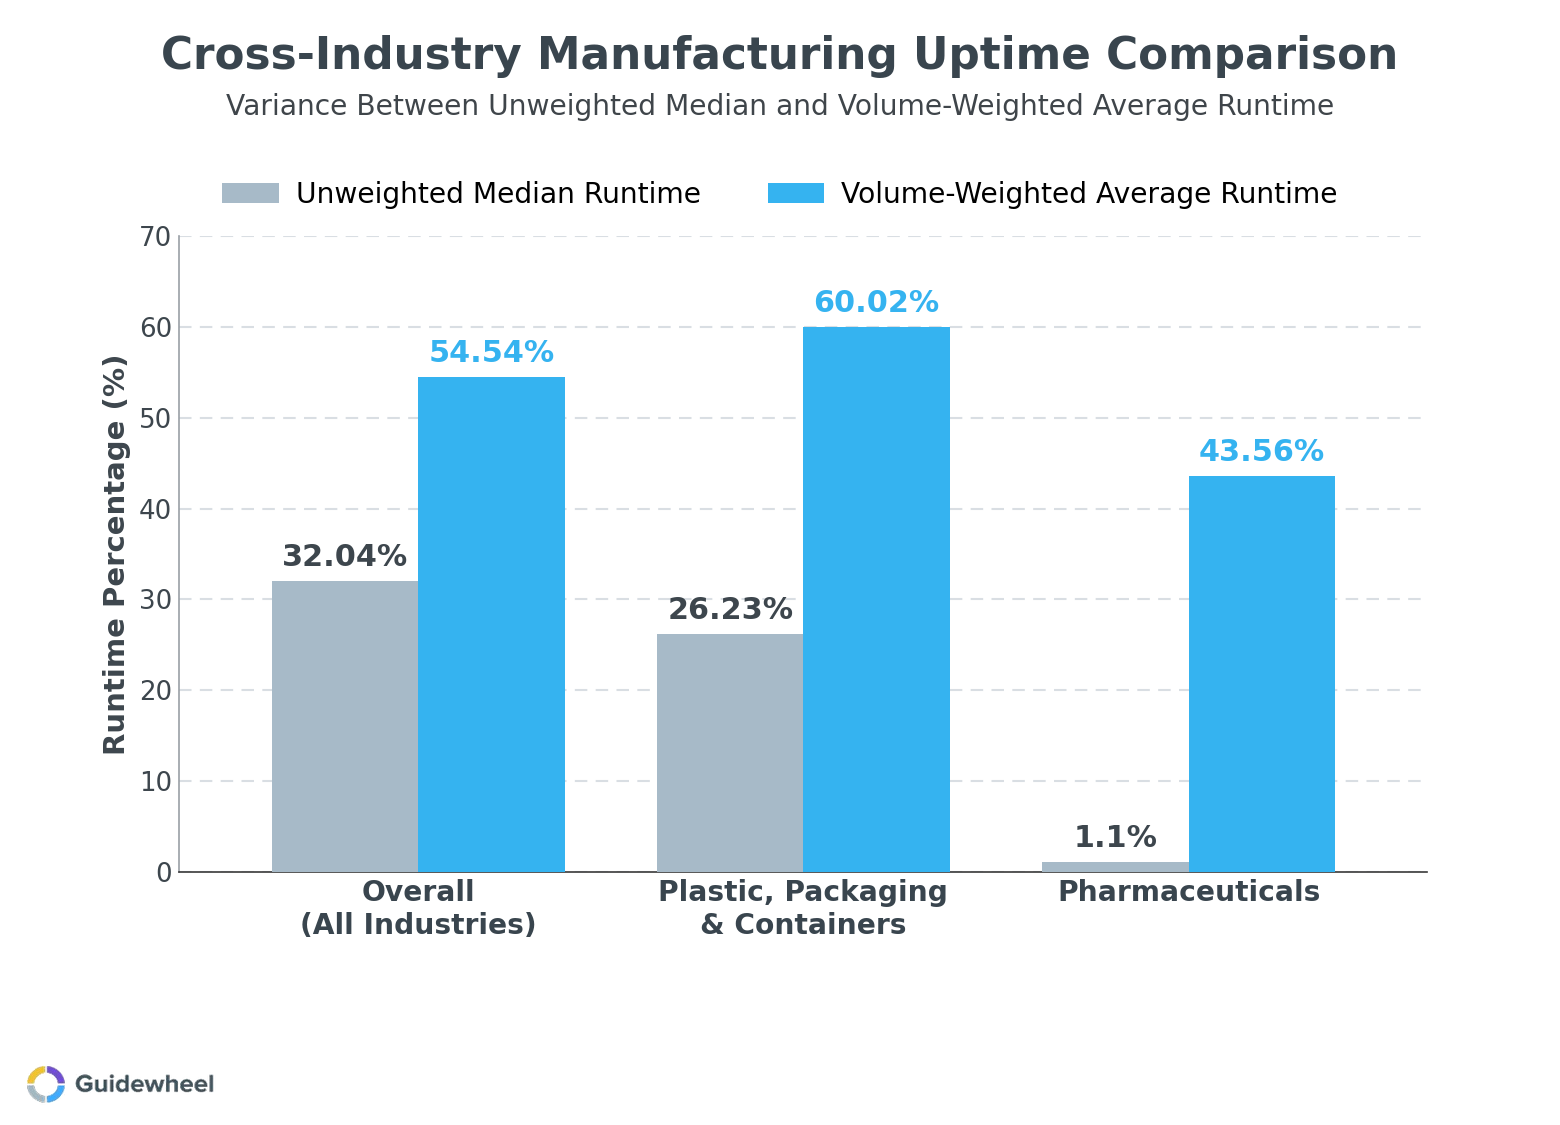 This chart illustrates a pattern worth understanding: there can be a significant gap between median machine uptime and volume-weighted runtime within the same sector. High-volume machines tend to run at considerably higher utilization, which pulls up the weighted average. But the median tells you what a “typical” machine is actually doing, and the gap between those two numbers represents unlocked capacity.
Within your own plant, this same dynamic plays out. If your top-quartile lines run at 85% availability while the median sits at 70%, that 15-point gap, multiplied by planned production hours and standard rates, represents real output you're leaving on the table. The best part? Your top-quartile lines prove it's achievable with your equipment, your products, and your people. The improvement path is studying what they do differently and scaling those practices.
These benchmarks are reference points, not universal targets. Every facility has unique product mixes, material characteristics, and operational priorities that influence what “good” looks like. The goal is to find your own internal gap and close it.
A five-step playbook for reducing machine downtime
So how do you actually reduce equipment downtime without a massive rip-and-replace project? Here's the framework that works:
Step 1: Get a run/idle/down signal on your critical assets
You don't need to connect every machine on day one to get started. Start with the bottleneck, the asset whose uptime most constrains your throughput or delivery. On newer equipment with PLCs, existing signals can sometimes be accessed — but Guidewheel's approach doesn't require PLC programming or integration work on any machine type. On older machinery, a simple clip-on current sensor on the motor supply can tell you whether the machine is running, idle, or stopped. Guidewheel's FactoryOps platform uses exactly this approach — working across all equipment types from legacy machines to brand-new lines, with cellular connectivity built in. No plant Wi-Fi required.
The key: you now have continuous, objective, time-stamped data instead of shift-end estimates.
Step 2: Add operator-friendly reason coding
Automated timing tells you when a machine stopped. Operator input tells you why. The trick is making it effortless. When the system detects a stop beyond a set threshold, it prompts the operator on a tablet near the machine to select a reason code with one or two taps.
Keep your initial code list short (8-12 categories). If more than 15% of events land in “Other,” it's time to add more specific codes. Involve operators in refining the list, as they'll engage more seriously when they see the taxonomy reflects their actual experience.
Step 3: Run your first Pareto and attack the top cause
With even two weeks of data, you can build a Pareto chart ranking downtime causes by total minutes lost. Per Guidewheel Performance Analysis, three to five causes typically account for 60% or more of total downtime. Pick the top one and assign a small, cross-functional team to observe, diagnose, and fix it.
For changeover overruns, that might mean pre-staging materials, organizing tools on shadow boards, and updating standard work. For recurring jams, it might mean adjusting sensor positions or replacing worn guides. These are low-cost, fast-cycle fixes that deliver visible results within days.
Guidewheel customers don't read that Pareto alone - prioritization support comes with the engagement, so you get help confirming which cause to go after first.
Step 4: Shift maintenance from reactive to proactive
Once you've captured the quick wins, turn your attention to maintenance strategy. Use your failure history and MTBF data to refine preventive maintenance intervals, tightening them for components that fail frequently and extending them where replacements are premature.
Where the data supports it, layer in condition-based approaches: vibration trending on critical motors, temperature monitoring on bearings, or current-draw analysis to detect mechanical binding before it becomes a breakdown. The shift from reactive to preventive and condition-based maintenance is what moves MTBF up and MTTR down over time.
Step 5: Standardize, benchmark, and scale
As your pilot lines improve, document what worked and replicate it. Standardize your reason code taxonomy, dashboard views, and governance routines across lines and shifts. Compare performance between similar assets to keep closing the gap between median and top-quartile.
Build a rhythm: daily shift huddles reviewing the prior shift's uptime, weekly cross-functional reviews of Pareto trends and MTBF, and monthly leadership reviews that connect downtime improvements to throughput, cost, and schedule attainment.
Changeover losses and micro-stops: the hidden capacity thieves
Two specific loss types deserve extra attention because they're so common and so fixable.
Changeover variability is often a bigger problem than changeover duration. Performance data across manufacturing sectors shows a median changeover variability of 57%, per Guidewheel Performance Analysis. That means the same changeover on the same line can take nearly twice as long depending on the shift, the crew, or whether materials were pre-staged. Applying SMED principles, converting internal steps to external ones, standardizing procedures, and using quick-release tooling can cut both the average and the variability dramatically.
Micro-stops on high-speed packaging lines are the other hidden drain. Each 30-second jam seems trivial. But 40 of them in a shift add up to 20 minutes of lost production, often invisible in manual logs. High-resolution machine data exposes these patterns and lets you correlate them with specific conditions: label roll lots, ambient humidity, worn brushes, or misaligned guides.
Start closing the gap this quarter
The path to reducing manufacturing downtime starts with a run/idle/down signal on your bottleneck, a simple reason code workflow for your operators, and a cross-functional team willing to act on what the data reveals. No big technology project required.
The plants that improve fastest share a common trait: they stop debating the numbers and start using a shared source of truth to drive weekly improvement cycles. That's the core of the playbook.
If you're ready to find the hidden capacity in your factory — starting with your toughest line — Book a Demo with Guidewheel. It works on all your equipment — no PLC programming, no IT project — deploys in days, and gives your team the run/idle/down data they need to start winning.
With Guidewheel, we now get key metrics like production, downtime, downtime codes, scrap, and cycle time automatically and accurately. Our team no longer takes time to track manually and has been able to instead invest that time in improvements.
Edgar Yerena, COO, Custom Engineered Wheels
💡
Frequently asked questions
What is downtime in manufacturing?
Downtime is any period during planned production time when your equipment is not producing saleable output at the intended rate. It's measured against the time you planned to be running, not total calendar time. So if your plant doesn't schedule production on weekends, those hours aren't counted as downtime. The critical split is between planned downtime (changeovers, PM, cleaning) and unplanned downtime (breakdowns, material shortages, staffing gaps). Both reduce availability and OEE, but they require different improvement strategies.
How do you calculate machine downtime?
The core formula is straightforward: Downtime = Planned Production Time minus Actual Operating Time. To express it as a percentage, divide downtime by planned production time and multiply by 100. For deeper analysis, track MTBF (total operating time divided by number of failures) and MTTR (total repair time divided by number of repairs). Together, these tell you whether improvements are coming from fewer failures, faster fixes, or both. To estimate the cost of downtime, multiply lost hours by your standard production rate, then by contribution margin per unit.
What are the most common causes of downtime in manufacturing?
Based on Guidewheel Performance Analysis of over 14,000 downtime events across 3,000+ machines, the most frequent controllable categories include operational disruptions, mechanical breakdowns, electrical and controls faults, staffing delays, and maintenance and cleaning activities. While demand-related gaps (no orders) can statistically dominate, they're outside the plant's direct control. The operational categories are where improvement efforts deliver the fastest returns. Each requires a different approach: mechanical issues respond to PM and condition monitoring, staffing losses respond to cross-training, and operational disruptions often signal a need for better reason code specificity.
How can machine monitoring help reduce downtime on legacy equipment?
Older machines without digital outputs can still be monitored using non-intrusive methods. A clip-on current sensor on a motor supply line can detect whether equipment is running, idle, or stopped — without any wiring changes or PLC integration. This simple signal, combined with time-stamped data capture and operator reason coding, gives you continuous, objective downtime tracking on machines that might be decades old. The result is the same quality of performance data you'd get from a brand-new line, which means your entire fleet, regardless of age, can be benchmarked and improved using the same framework.
When should a plant use preventive versus predictive maintenance to reduce downtime?
Start with preventive maintenance as your foundation: scheduled tasks at set intervals based on manufacturer recommendations and your own failure history. Use your MTBF data to validate and refine those intervals. Then layer in condition-based and predictive approaches where the failure consequences are severe and where condition indicators (vibration, temperature, current draw) reliably signal degradation before breakdown. Not every asset justifies the investment in condition monitoring. Focus predictive efforts on bottleneck equipment and high-consequence failure modes where unplanned stops have the biggest impact on throughput and delivery.
About the author
Lauren Dunford is the CEO and Co-Founder of Guidewheel, a FactoryOps platform that empowers factories to reach a sustainable peak of performance. A graduate of Stanford, she is a JOURNEY Fellow and World Economic Forum Tech Pioneer. Watch her TED Talk—the future isn't just coded, it's built.

