No items found.
blog
Machine-Level Energy Monitoring on the Factory Floor
By: Guidewheel
Updated:
June 9, 2026
8 min read
Every plant manager knows the monthly utility bill tells you something, but it rarely tells you enough. You see the total kilowatt-hours, maybe a demand charge that spikes unpredictably, and a number that finance asks you to shrink. What you don't see is which machines drove that number, which shifts ran lean, and which assets sat idle burning power at 2 AM on a Sunday.
That gap between facility-level totals and what each machine is actually doing is where most energy improvement programs stall. The good news: closing it doesn't require a multi-year IT project or a fleet of expensive submeters wired into every PLC. Machine-level energy monitoring on the factory floor is now a practical way to get fast visibility into run states, idle waste, phantom loads, and cost per part from each machine's electrical signature.
Here's how it works, what the data shows, and how to get started without disrupting production.
Key terms to know before we dig in
Term |
Plain-English definition |
|---|---|
kWh per machine |
Total kilowatt-hours consumed by a single asset over a period, the foundation for all per-asset energy analysis |
Energy per part |
kWh divided by good parts produced — connects energy cost directly to output |
Phantom load |
Power drawn by equipment that should be off, often overnight or on weekends |
Peak demand charge |
A utility fee based on your highest average power draw during any 15-minute window in the billing cycle |
Machine state |
Whether an asset is running, idle, in changeover, or fully off, inferred from its power signature |
Current transformer (CT) |
A clip-on sensor that reads electrical current on a conductor without disconnecting wiring |
Why your utility meter isn't enough
Facility-level monitoring answers one question: How much did we use? It blends production equipment, HVAC, compressed air, and lighting into a single number. You can't trace a demand spike back to a specific press, and you can't tell whether a high-consumption day was driven by strong throughput or excessive idle time.
For operations leaders responsible for throughput, labor efficiency, and cost per unit, the real questions are different:
Which machines consumed the most energy relative to output?
Where are we idling under load between jobs or during changeovers?
What's drawing power at midnight when nothing should be running?
Which shift achieves the lowest kWh per part, and why?
Facility data can't answer any of these. Machine-level energy monitoring can.
How clip-on current sensing turns power into machine states
You don't need a PLC integration or a controls engineer to track kWh per machine. The simplest, least disruptive path uses non-invasive current transformers, split-core or flexible sensors that clamp around existing power conductors inside a panel. No wiring changes, no production stoppage.
These sensors feed current readings to an edge gateway that timestamps the data and transmits it, often over cellular, so you don't even need to touch the plant network. The system then turns raw current into meaningful machine states: running, idle, changeover, or off.
Why does this work? Because every machine has a distinct electrical "heartbeat." A CNC machining center draws a steady base load when idle, then spikes when the spindle engages material. A packaging line steps up as motors, conveyors, and actuators activate. Guidewheel's FactoryOps platform uses clip-on sensors that work on all equipment, from decades-old legacy machines to brand-new lines, and processes those signals through proprietary algorithms to automatically distinguish productive run time from nonproductive idle and off states — no PLC required.
The result is a continuously updated machine-state timeline for every monitored machine, refreshed in seconds.
Calculating kWh per machine and energy per part
Once you're capturing power data at the asset level, the math is straightforward:
Metric |
Formula |
What it tells you |
|---|---|---|
Total kWh per machine |
Sum of (power × time interval) across a shift or day |
Absolute energy consumption by asset |
Energy per part (kWh/part) |
Total machine kWh ÷ good parts produced |
Energy cost tied directly to revenue-generating output |
Idle energy fraction |
kWh consumed in idle states ÷ total machine kWh |
Share of energy spent not producing |
Cost per part (energy) |
kWh/part × blended electricity rate |
Monetary energy cost per unit, comparable to material and labor cost |
The idle energy fraction is often the eye-opener. On complex equipment like CNC machines, injection molding presses, and extrusion lines, control electronics, coolant pumps, hydraulics, and barrel heaters keep drawing significant power even when no parts are being made. It's not uncommon for plants to discover that 20–40% of a key machine's energy is consumed during idle states. That's money flowing out the door without a single part to show for it.
✅
When two identical machines show different kWh per part, the gap usually points to maintenance condition, operator practice, or scheduling discipline — all fixable without capital expenditure. Comparing energy per part across shifts and operators is one of the fastest ways to surface coaching opportunities and standardize best practices across the floor.
When two identical machines show different kWh per part, the gap usually points to maintenance condition, operator practice, or scheduling discipline, all fixable without capital expenditure.
Finding phantom loads hiding in plain sight
Here's the question: Why does a machine draw high power while it's sitting idle, or worse, when the plant is supposedly shut down?
That's your phantom load. Compressors cycling to compensate for air leaks, CNC machines left powered overnight "just in case," coolant systems running with no production scheduled. Without machine-level data, these loads are invisible inside the aggregate base load on your utility meter.
With asset-level monitoring, you can pull an off-shift energy report that ranks every machine by its overnight and weekend power draw. The biggest offenders get flagged, root causes get investigated, and simple fixes — better shutdown checklists, automatic sleep modes, interlocks between machines and conveyors — start delivering savings immediately.
Because off-shift energy reductions don't affect throughput, they're often the purest "free money" in the plant. No trade-offs, no production risk.
Which machines are driving your peak demand charges?
In many industrial tariffs, demand charges are based on your highest 15-minute average power draw in the entire billing period. One bad quarter-hour can set the rate for the whole month.
Machine-level monitoring decomposes your total plant load into individual machine contributions in real time. So instead of asking "why was our demand charge so high?", you can see exactly which assets were running simultaneously during that peak window. Common culprits:
Multiple large motors starting at shift change within the same 15-minute window
Energy-intensive test or cleaning equipment overlapping with peak production
High-base-load machines left idling during on-peak tariff hours
Armed with this data, you can stagger start-ups, reschedule non-critical loads to off-peak windows, or set alerts that warn supervisors as total plant load approaches a threshold. These are operational changes, not capital projects — and they can meaningfully cut demand charges.
What the benchmarks actually show
Here's what machine-level monitoring reveals across a broad set of plants. Analysis from Guidewheel's FactoryOps platform, covering 3,000+ tracked machines across 13 manufacturing sectors, shows asset utilization ranging from under 3% to nearly 96% across sectors (Source: Guidewheel Performance Analysis).
![]()
These benchmarks serve as reference points, not universal targets. Every facility has unique product mixes, scheduling constraints, and operational priorities. But the spread tells a clear story: there's almost always hidden capacity waiting to be unlocked once you can see run, idle, and off states by individual machine.
Where downtime categories reveal energy waste
Energy patterns and downtime patterns are two sides of the same coin. When you categorize why machines stop, you also categorize where energy gets wasted.
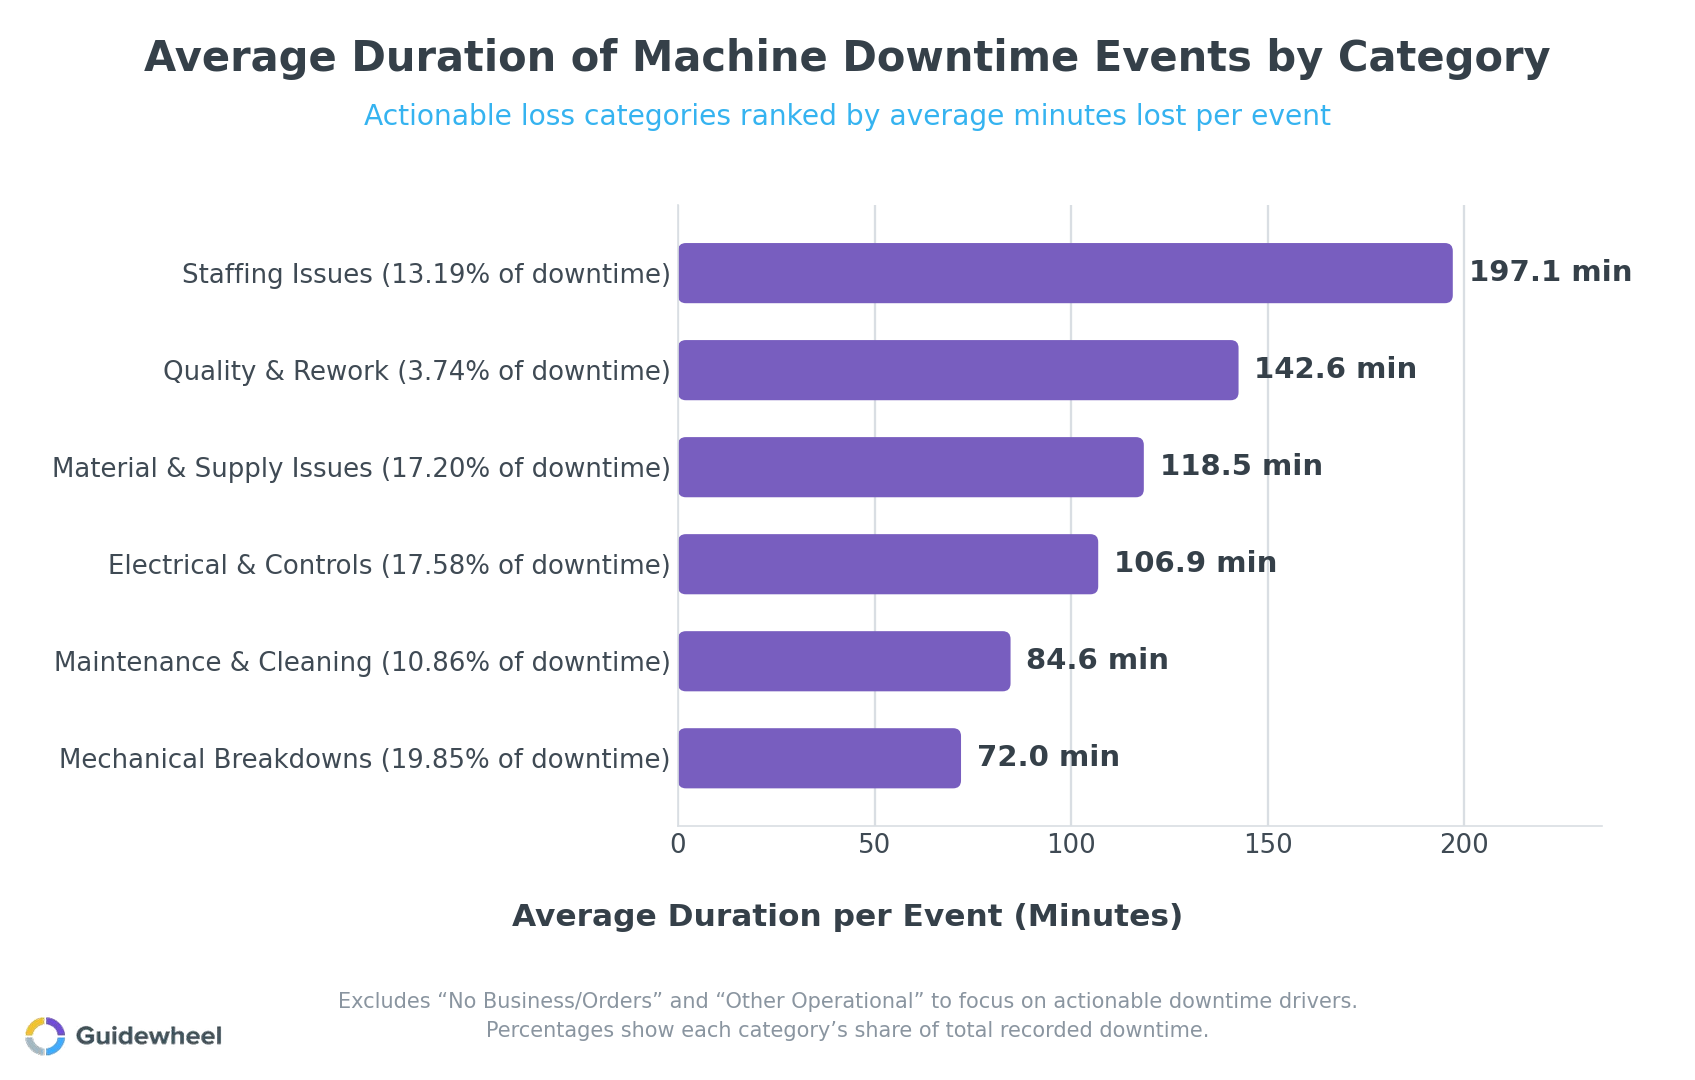
The most actionable categories for plant teams are the ones within direct operational control:
Downtime category |
Avg. duration per event |
Why it matters for energy |
|---|---|---|
Staffing issues |
197 min |
Machines idle under load waiting for operators |
Material & supply issues |
119 min |
Upstream starvation keeps equipment drawing power with no output |
Electrical & controls |
107 min |
Fault conditions may leave systems partially energized |
Maintenance & cleaning |
85 min |
Scheduled stops where shutdown discipline can cut idle energy |
Mechanical breakdowns |
72 min |
Frequent events that accumulate significant idle kWh at scale |
Changeover variability compounds the problem. With a median changeover variability of 57% across tracked machines (Source: Guidewheel Performance Analysis), shift-to-shift inconsistency means some teams idle machines far longer than others during transitions. Machine-level energy data makes this variation visible and coachable, without finger-pointing.
A practical implementation playbook
You don't need to instrument every machine on day one. Here's a straightforward path:
Pick 3–5 high-value assets. Focus on bottleneck machines, your largest energy consumers, or lines with known performance variability.
Install clip-on sensors during normal operations. Non-invasive current transformers mount inside existing panels without production interruption. Cellular connectivity means no IT network changes.
Start reviewing data in daily huddles within the first week. Look at run/idle/down data, kWh per part, and off-shift phantom loads. Don't wait for a "perfect" dataset.
Target one quick win. Maybe it's a shutdown checklist that eliminates weekend phantom load. Maybe it's staggering start-ups to flatten a demand peak. Pick something visible and measurable.
Expand based on results. Once the pilot delivers a documented improvement, use that momentum to add more machines, more lines, and eventually more sites.
This start-small approach keeps risk low and builds internal champions who have seen the data work. Most plants that follow this path see meaningful payback within 6 to 18 months (Source: Guidewheel Performance Analysis), and many of the early wins, like phantom load elimination and demand peak reduction, show up on the very next utility bill.
Start turning energy data into production gains
The biggest energy opportunities on your factory floor are almost always production opportunities in disguise. Hidden idle time, inconsistent shift practices, phantom loads, and unmanaged demand peaks all drain both throughput and utility budgets simultaneously. Machine-level energy monitoring gives you the machine-level visibility to find them, fix them, and verify the improvement, without a disruptive overhaul.
We had our best month of the year, increasing production from 26k-35k/month to 46k cases in March. I attribute this to Guidewheel. Being able to see downtime data and address downtime reasons directly correlates to higher production.
Michael Palmer, VP of Operations, Direct Pack (Source: Guidewheel's Customer Research)
If you're ready to see what hidden capacity your machines are leaving on the table, Book a Demo and start with a handful of your most critical assets. The data comes fast — and so do the first wins.
💡
Frequently asked questions
What is the difference between factory-level energy monitoring and machine-level energy monitoring?
Factory-level monitoring captures total facility consumption through main utility meters, telling you how much energy the plant used overall. Machine-level monitoring instruments individual assets with dedicated sensors, revealing what each machine was doing with that energy: running productively, sitting idle, or drawing phantom load when it should have been off. The difference is the gap between knowing your total electricity bill and knowing which specific machines, shifts, and operating conditions drove it.
How do manufacturers measure kWh per machine without a PLC?
Non-invasive current transformers clip around existing power conductors inside a machine's electrical panel. These sensors read current draw without any wiring changes or PLC programming. An edge gateway digitizes the readings, timestamps them, and transmits the data, often over cellular, to a cloud platform where algorithms calculate kWh, infer machine states, and derive metrics like energy per part. This approach works on all equipment regardless of age or brand.
Can power signatures actually detect whether a machine is running, idle, or down?
Yes. Every machine has a characteristic electrical profile. A CNC draws a steady base load when idle and higher, more variable power when the spindle is cutting. A packaging line steps through distinct power levels as different motors and actuators engage. Algorithms analyze these patterns in real time, classifying each interval as a specific machine state. The result is a continuous timeline of run, idle, changeover, and off periods for every monitored asset.
What types of machines offer the fastest ROI from energy monitoring?
Bottleneck equipment, machines with high base loads and significant idle time, and assets subject to cross-shift variability typically deliver the quickest returns. CNC machining centers, injection molding presses, extrusion lines, and packaging systems are common starting points. Any machine where idle power draw is a large fraction of running power draw represents a strong candidate, because reducing idle time simultaneously recovers both capacity and energy cost.
How can plants deploy energy monitoring without production downtime or major IT projects?
Clip-on current sensors install inside existing electrical panels without disconnecting anything, so machines keep running during setup. Cellular-connected gateways transmit data independently of the plant network, removing the need for IT infrastructure changes or firewall configurations. Most pilot deployments cover a handful of machines and go live within days, not months, with operators reviewing dashboards in their first week.
About the Author
Lauren Dunford is the CEO and Co-Founder of Guidewheel, a FactoryOps platform that empowers factories to reach a sustainable peak of performance. A graduate of Stanford, she is a JOURNEY Fellow and World Economic Forum Tech Pioneer. Watch her TED Talk—the future isn't just coded, it's built.

