No items found.
blog
Takt Time: The Definitive Manufacturing Guide
By: Guidewheel
Updated:
June 12, 2026
8 min read

Every plant manager knows the feeling: the schedule says you need 800 units by end of shift, but by hour three, you're already behind. The question isn't whether your team is working hard enough. The question is whether your production pace actually matches what your customers are asking you to deliver.
That's the problem takt time solves. It translates customer demand into a required rhythm for production, giving every operator, supervisor, and director a shared number to rally around. But here's where most plants get stuck: they calculate takt time once during a lean workshop, pin it to a whiteboard, and never connect it to what their machines are actually doing.
This guide walks you through the takt time formula, how to calculate it from real shift schedules, how it compares to cycle time and lead time, and, most importantly, how to close the gap between the pace you need and the pace you're getting.
Understanding the key production metrics
Before we get into the formula, let's make sure we're talking about the same thing. These three metrics answer fundamentally different questions, and confusing them is one of the fastest ways to create misalignment between planning, production, and maintenance.
Metric |
What it answers |
Driven by |
Units |
|---|---|---|---|
Takt time |
How often must we finish a unit to meet demand? |
Customer demand |
Seconds/unit |
Cycle time |
How often do we actually finish a unit? |
Machine and process capability |
Seconds/unit |
Lead time |
How long does the customer wait from order to delivery? |
Total system flow and WIP |
Hours or days |
Takt time is your target drumbeat. Cycle time is what your equipment and people actually deliver. Lead time is what your customer experiences. When cycle time exceeds takt, you fall behind. When lead time balloons despite good cycle times, the problem is usually WIP and batching, not machine speed.
Put simply: takt is demand, cycle is what the process can do, and lead time is what the customer feels. You need all three working together.
The takt time formula (and how to get it right)
The takt time calculation itself is straightforward:
Takt Time = Available Production Time / Customer Demand
The math isn't the hard part. It's defining the inputs correctly.
Available production time is not your total shift length. It's the net time your line is planned to run, after subtracting breaks, shift-change meetings, and other scheduled non-production periods. Here's a quick example:
Input |
Value |
|---|---|
Shift length |
480 min (8 hrs) |
Lunch break |
30 min |
Two rest breaks |
20 min |
Shift startup meeting |
10 min |
Available production time |
420 min |
Customer demand per shift |
840 units |
Takt time |
30 sec/unit |
That means your line needs to produce one good unit every 30 seconds to keep pace with demand.
A common mistake? Subtracting unplanned downtime from available time. Don't do that. Takt time should reflect what demand requires, not what your current problems allow. If you bake breakdowns into the formula, you'll never see the gap between target and reality.
Another pitfall: using different definitions of "available time" across plants. If one site excludes changeovers and another includes them, their takt times aren't comparable. Standardize the definition, then apply it consistently.
How to calculate takt time for your shift schedule
Here's a step-by-step approach you can follow for any line:
Start with your total shift time in minutes
Subtract all planned non-production time (meals, meetings, breaks where the line stops)
Convert the result to seconds if you want seconds-per-unit output
Divide by the number of units your line is responsible for producing that shift
The result is your takt time in seconds per unit
For a quick takt time calculator in Excel, try this layout:
Cell |
Label |
Formula |
|---|---|---|
B2 |
Shift length (min) |
480 |
B3 |
Total break/meeting time (min) |
60 |
B4 |
Demand (units/shift) |
840 |
B5 |
Takt time (sec/unit) |
=(B2-B3)*60/B4 |
B6 |
Takt rate (units/hr) |
=B4/((B2-B3)/60) |
When your product mix changes daily, recalculate takt using the aggregate demand assigned to your line for that day. For multi-SKU lines, total all units across SKUs, compute a single line-level takt, then use detailed scheduling to sequence changeovers within that constraint.
Takt time vs cycle time: what to do when they don't match
This is where takt time starts to help you run the floor differently. Three scenarios matter:
Scenario |
What it means |
What to do |
|---|---|---|
Cycle time < takt time |
You have capacity headroom |
Monitor for overproduction; use the margin for changeovers or demand spikes |
Cycle time ≈ takt time |
Razor-thin margin |
Any variability will cause missed targets; reduce downtime and stabilize processes |
Cycle time > takt time |
You can't keep up |
Prioritize constraint: reduce changeover, improve uptime, add capacity, or reallocate demand |
When your actual cycle time is consistently slower than takt, the root cause almost always traces back to losses that inflate your effective cycle time: unplanned stops, speed reductions, minor jams, changeovers, and material delays. A machine might have an ideal cycle time of 25 seconds, but if OEE is only 75%, the effective time per good unit climbs to roughly 33 seconds, and a 30-second takt becomes impossible.
✅
A machine's ideal cycle time can be misleading if OEE isn't factored in. Use the formula Effective Cycle Time = Ideal Cycle Time / OEE to get the real picture. For example, a 25-second ideal cycle time at 75% OEE means you're actually producing one good unit every 33 seconds — which could push you past your takt target. Always compare effective cycle time, not ideal cycle time, against takt when assessing whether your line can meet demand.
The relationship is simple:
Effective Cycle Time = Ideal Cycle Time / OEE
If your effective cycle time exceeds takt, you need to either improve OEE on the constraint or add available time (more shifts, less planned downtime).
Takt time vs lead time: why customers still wait
Even when cycle times are below takt, customers can experience long lead times. Usually, it's work-in-process inventory sitting between steps.
Little's Law makes this tangible: Lead Time = WIP / Throughput Rate. If you're producing 100 units per hour but have 500 units of WIP in the system, your lead time is 5 hours, regardless of how fast each individual station runs.
Takt time sets the pace. Lead time depends on flow. Reducing batch sizes, shrinking buffers, and moving toward more continuous flow are where lead time improvements happen, even when takt stays the same.
Why your line keeps missing takt (and where to look first)
Here's the uncomfortable truth: most plants know their takt time. Far fewer know, in real time, where they're losing the minutes that prevent them from hitting it.
Guidewheel's analysis of performance data across 3,000+ machines reveals that the biggest production disruptions aren't always the ones you'd expect (Source: Guidewheel Performance Analysis):
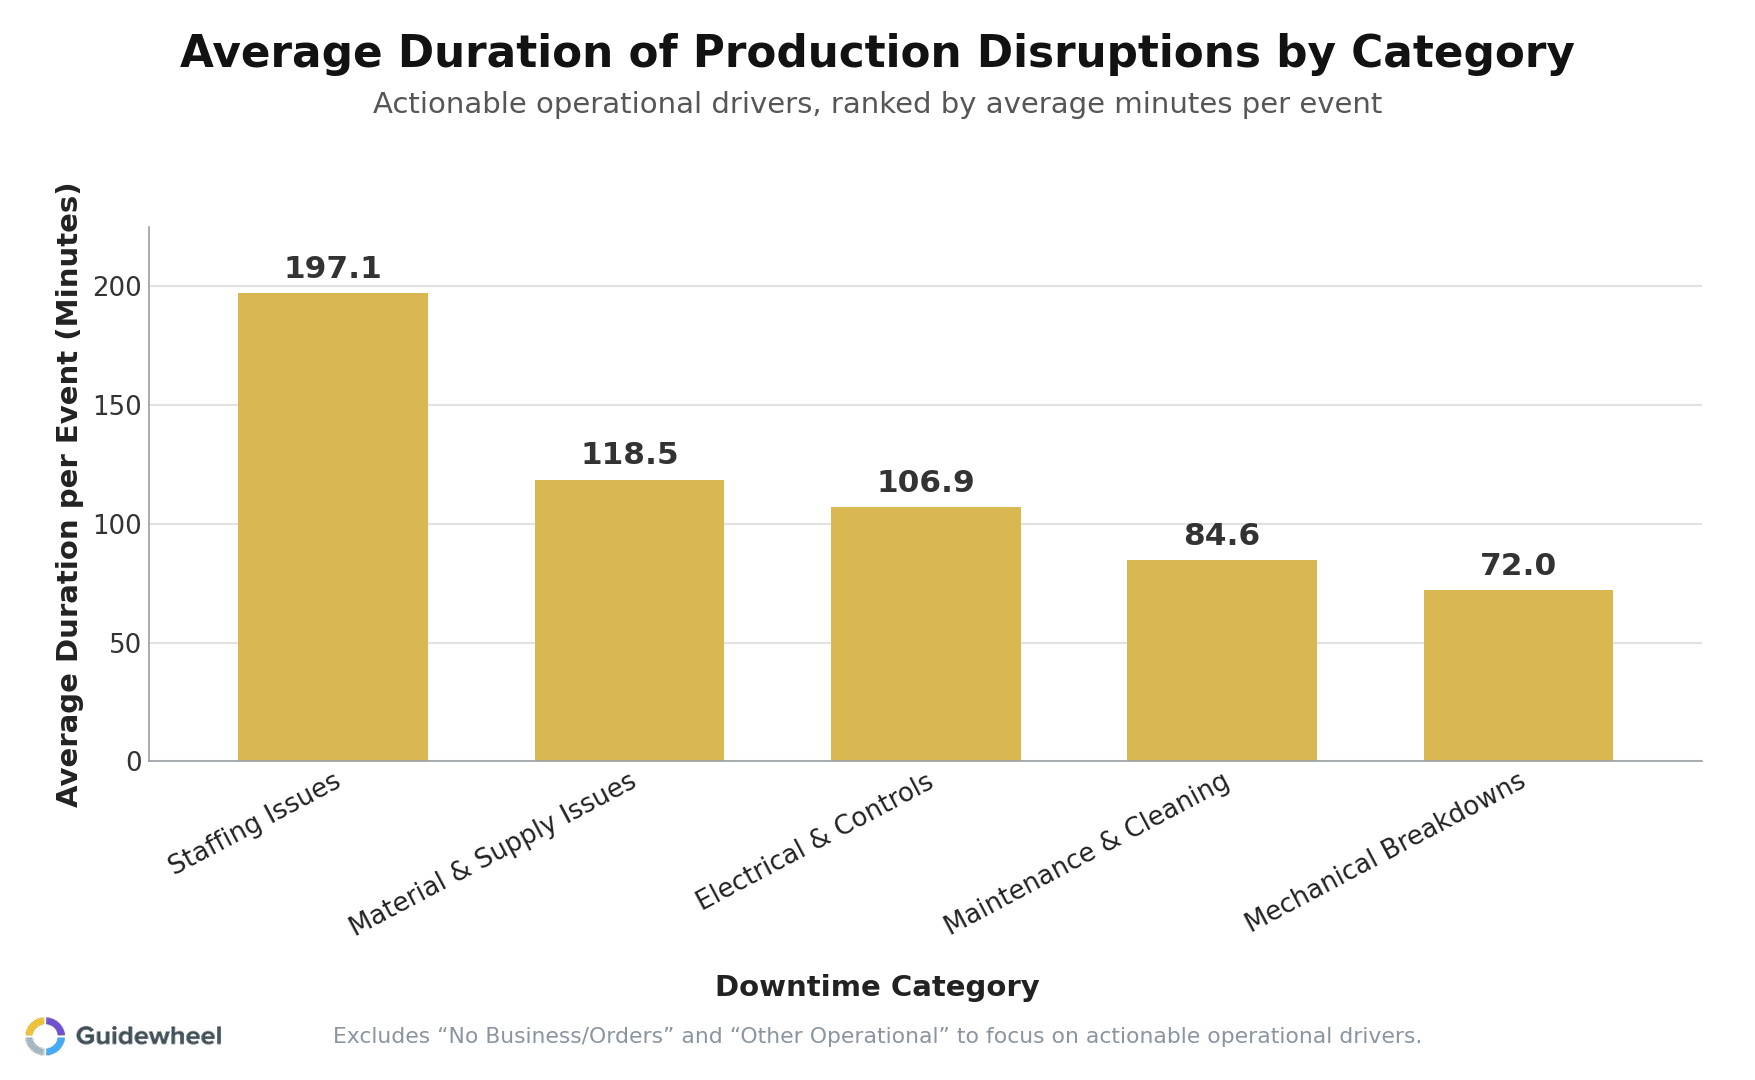
While demand-related halts (no orders) drive the longest individual stoppages at 318 minutes per event, the categories within your direct control tell a more actionable story:
Downtime category |
Avg. duration per event |
Why it matters |
|---|---|---|
Staffing issues |
197 min |
Long stoppages; often predictable with better scheduling |
Material & supply |
119 min |
Upstream flow problems starving the line |
Electrical & controls |
107 min |
Hard to diagnose; line waits on a controls tech |
Maintenance & cleaning |
85 min |
Planned but often over-running; SMED principles apply |
Mechanical breakdowns |
72 min |
Most frequent; shorter per event but cumulative impact is significant |
Each of these categories directly subtracts from your available production time and inflates your effective cycle time. Staffing gaps and material delays, in particular, cause longer per-event stoppages than mechanical breakdowns, yet they're frequently under-tracked.
The first step is knowing where the time actually goes. Guidewheel's FactoryOps platform clips onto virtually any machine — from decades-old legacy presses to brand-new lines — using clip-on current sensors that read electrical current. The platform turns those signals into run/idle/down data and production counts without requiring PLC integration or an IT project. That means you can overlay takt-based targets on live machine data within days, not months.
Uptime varies more than you think
Your takt time calculation assumes a certain amount of available time. But how much time is actually available varies enormously depending on your industry and equipment mix.
![]()
This chart illustrates how baseline uptime assumptions shift depending on whether you look at the median machine or weight by production volume. In plastics and packaging, the median runtime (as a percentage of available shift time) is around 26%, but high-volume machines pull the weighted average up to 60%. That's a massive gap, and it means your takt time feasibility depends heavily on which machines you're running and how consistently they perform.
Use these benchmarks as a reference point, not a universal target. Every facility's product mix, equipment age, and operational priorities create a unique performance profile.
A practical roadmap to improve takt attainment
Establish your baseline. Calculate takt from real shift schedules and current demand. Measure actual cycle times and uptime on your constraint resources for at least two weeks.
Identify the gap. Compare effective cycle time (ideal cycle time / OEE) against takt. If the gap is small, focus on stabilizing. If it's large, focus on the constraint.
Categorize your downtime. Don't just track total downtime. Break it into mechanical, staffing, material, changeover, and operational buckets so you can prioritize.
Attack changeover variability. Performance data shows a median changeover variability of 57% shift-to-shift (Source: Guidewheel Performance Analysis). That unpredictability is often a bigger threat to takt than the changeover duration itself.
Make takt visible. Display target-vs-actual output on the floor. Use hourly targets, not just end-of-shift goals, so teams can course-correct in the moment.
Review at short intervals. Hourly or bi-hourly check-ins against takt-based targets, supported by live production data, catch problems while there's still time to recover.
Start closing the gap between target pace and actual output
Takt time only matters if it drives decisions on the floor, not just in the planning office. The manufacturers who consistently hit their targets aren't the ones with the fanciest spreadsheets. They're the ones who connect demand to live machine performance, so every shift can see where they stand and where they're losing time.
We had our best month of the year, increasing production from 26k-35k/month to 46k cases in March. I attribute this to Guidewheel. Being able to see downtime data and address downtime reasons directly correlates to higher production.
Michael Palmer, VP of Operations, Direct Pack
If you're ready to turn takt time from a static number into a live operating tool, Book a Demo to see how Guidewheel's FactoryOps platform connects to your existing equipment — and starts unlocking the hidden capacity your current data can't see.
💡
Frequently asked questions
What is takt time in manufacturing?
Takt time is the maximum amount of time you can spend producing one unit and still meet customer demand. It's calculated by dividing your available production time by the number of units customers require in that period. The word comes from the German "Taktzeit," meaning rhythm or beat, and it was popularized by the Toyota Production System as the heartbeat of production flow.
Should cycle time be less than takt time?
Yes. If your actual cycle time exceeds takt time, you can't meet demand without adding capacity, shifts, or overtime. Ideally, cycle time sits slightly below takt to create a buffer against variability from downtime, speed losses, and changeovers. Running exactly at takt with zero margin means any disruption will cause you to fall behind.
How do downtime and machine uptime affect takt time performance?
Takt time assumes your line is running during all available production time. Every minute of unplanned downtime, whether from breakdowns, staffing gaps, or material delays, reduces the actual time you have to produce. This inflates your effective cycle time and narrows or eliminates your margin against takt. Tracking downtime by category helps you focus improvement efforts on the losses that matter most to schedule attainment.
How should high-mix or batch production environments use takt time?
In high-mix settings, calculate takt at the product family level using aggregate demand across similar parts. You can also use "capacity takt," which expresses demand in hours of work rather than discrete units, to manage shared resources like CNC cells or welding departments. The core logic of matching available time to demand still applies, even when individual orders vary.
How can machine monitoring help plants meet takt consistently?
Machine monitoring captures run/idle/down status and production counts directly from equipment, then overlays takt-based targets on live dashboards. This gives operators and supervisors immediate feedback on whether the current pace will meet the shift target. When combined with downtime reason tracking and Pareto analysis, it turns takt from a planning artifact into a continuous feedback loop for the floor.
About the author
Lauren Dunford is the CEO and Co-Founder of Guidewheel, a FactoryOps platform that empowers factories to reach a sustainable peak of performance. A graduate of Stanford, she is a JOURNEY Fellow and World Economic Forum Tech Pioneer. Watch her TED Talk—the future isn't just coded, it's built.

