No items found.
blog
Machine Monitoring Without IT: The No-PLC Buyer's Guide
By: Guidewheel
Updated:
June 10, 2026
8 min read
If you run a plant with mixed-age equipment, you already know the frustration: your newest lines feed data into dashboards, while your legacy presses, CNCs, and packaging machines give you little to no visibility. You suspect there's hidden capacity on those older assets, but you can't prove it because there's no PLC to tap into, no SCADA historian logging events, and no controls engineer with six free weeks to wire something up.
Here's the good news. You don't need any of that. Machine monitoring without PLC integration is not only possible today, it's fast, non-invasive, and designed for plant teams to deploy without waiting on IT or corporate engineering. This guide shows how it works, what data you can actually capture, and how to prove value in weeks.
Key terms worth knowing before we dig in
If some of these acronyms are new to your team, here's a quick reference:
Term |
What it means in plain English |
|---|---|
PLC (Programmable Logic Controller) |
The computer inside a machine that runs its control logic. Many legacy machines don't have one, or it's locked down. |
SCADA |
Supervisory software that collects data from PLCs across a facility. Great where it exists, but expensive to extend. |
Availability x Performance x Quality. The gold standard metric for how well a machine converts scheduled time into good parts. |
|
CT Sensor (Current Transformer) |
A clip-on sensor that wraps around a power cable to read electrical current without breaking the circuit. |
Edge Device |
A small gateway installed near the machine that processes sensor signals locally and sends summarized data to the cloud. |
Now let's look at why the traditional approach leaves most of your floor in the dark.
Why PLC and SCADA monitoring leave most machines invisible
The usual monitoring approach assumes every machine has an accessible PLC with clear tags for run, stop, idle, and alarm states. In reality, a typical multi-asset plant looks more like this:
A handful of newer lines with modern controllers and network connectivity
A large middle tier of mid-generation equipment with proprietary or locked-down controls
A long tail of vintage presses, manually loaded cells, and semi-automatic assets with no PLC at all
Extending SCADA to that middle tier and long tail requires controls engineering time, PLC code modifications, network architecture changes, and IT security reviews. Each machine can take days or weeks of integration work. When your engineering team is already stretched thin and IT is focused on ERP upgrades and cybersecurity, those projects stall indefinitely.
The result? Partial coverage. And partial coverage creates a dangerous illusion: the machines you can see look like the problem children (because their issues are logged), while the legacy assets seem fine (because nobody's recording the short stops, changeover creep, and chronic minor faults eating their capacity).
How clip-on current sensors capture machine truth without a PLC
This is where non-invasive machine monitoring changes the equation. The core principle is simple: almost every industrial machine, regardless of age or manufacturer, has motors that draw electrical current when running.
A clamp-on current sensor wraps around the power cable feeding a motor. No wires to cut, no cabinets to rewire, no PLC programs to modify. The sensor reads the current signature, and an edge device classifies what that signature means:
High, steady current = machine is running under load
Low baseline current = machine is powered on but idle
Near-zero current = machine is off
Repeating current spikes = individual production cycles (enabling cycle counting on presses, molding machines, and similar equipment)
Proprietary algorithms process these raw signals into run/idle/down state timelines, tracking — with precise timestamps — exactly when each asset is running, idling, or down. That alone is a big step forward for plants used to shift-end paper logs and best-guess estimates.
✅
Current-based state detection gives you Availability and Performance data directly — no PLC or plant network connection required. Pair it with operator-entered scrap counts and you have all three OEE components. Systems like Guidewheel's FactoryOps platform operate over cellular connections, bypassing the corporate network entirely, which means you can track OEE without IT support or a network connection to the machine.
So, can you track OEE without IT support or a network connection to the machine? Yes. Current-based state detection gives you Availability and Performance data directly. Pair it with operator-entered scrap counts and you have all three OEE components — captured without touching a PLC or plant network. Guidewheel's FactoryOps platform operates over cellular connections, bypassing the corporate network entirely.
When to add wireless vibration and temperature sensors
Current sensing covers the "Is the machine running?" question across most of your floor. But for critical rotating equipment like spindle bearings, gearbox motors, pumps, and compressors, you may also want to answer: "Is the machine healthy?"
Wireless vibration and temperature sensors fill that gap. Mounted externally with magnets or adhesive, they detect early signs of imbalance, misalignment, bearing wear, and overheating, often weeks before a catastrophic failure.
Signal type |
Best for |
What it detects |
|---|---|---|
Current (CT clamp) |
Motors, drives, any electromechanical load |
Run/idle/down state, cycle counts, load profiles |
Vibration (wireless) |
Bearings, spindles, gearboxes, pumps |
Imbalance, misalignment, bearing wear, looseness |
Temperature (wireless) |
Motors, panels, gearboxes, heaters |
Overheating, lubrication issues, airflow problems |
For mixed-asset plants, the right strategy is a hybrid approach: current sensors on everything to establish a utilization baseline, plus wireless condition sensors on your most failure-prone rotating assets for predictive maintenance. This combination means your operations team gets production data immediately, and your maintenance team gets early fault warnings, all from the same platform.
The visibility gap your data is probably hiding
When plants first deploy automated monitoring on legacy equipment, the numbers are often surprising. Assets that everyone assumed were "running most of the shift" turn out to spend significant time idle, stalled by short stops and changeover overruns that never made it into manual logs.
Guidewheel performance data across 3,000+ machines illustrates this pattern clearly. The weighted average runtime across industries sits at roughly 55%, but the median machine, when treated equally regardless of volume, runs only about 32% of its available time (Source: Guidewheel Performance Analysis). High-volume continuous processes heavily skew the overall statistics, masking how much idle time exists on typical discrete and semi-automatic equipment.
![]()
These benchmarks are reference points, not universal targets. Your facility's product mix, shift structure, and operational priorities all shape what "good" looks like. But that gap between perceived and actual utilization? That's where hidden capacity lives, and you can't unlock it if you can't see it.
The downtime categories you can actually control
Knowing a machine is down is step one. Knowing why it's down is where the real gains happen. When you pair automated state detection with simple operator reason codes, patterns show up fast.
Across a separate Guidewheel dataset of 3,600+ logged downtime events, the top plant-controlled loss categories break down like this:
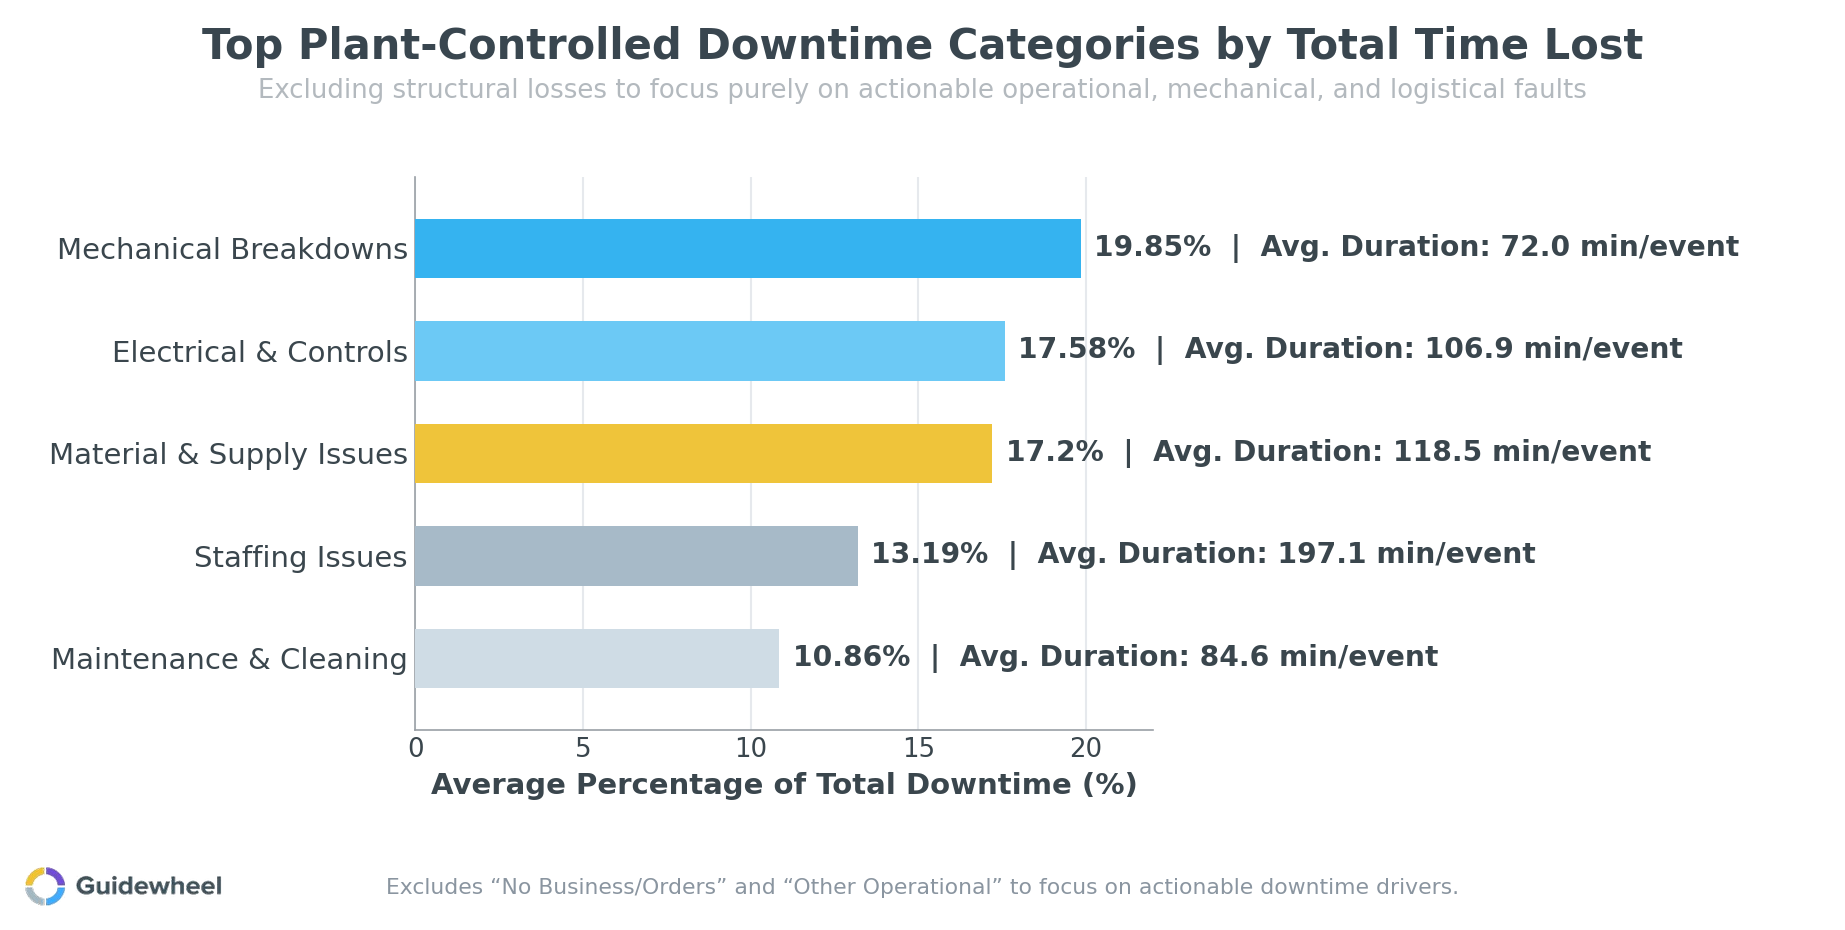 What stands out is how much lost time comes from categories your team can directly address:
Mechanical breakdowns (20%) averaging 72 minutes per event, are prime targets for condition monitoring with vibration and temperature sensors
Electrical and controls faults (18%) averaging 107 minutes each, benefit from current-based anomaly detection that catches irregular signatures before full failures
Material and supply delays (17%) averaging 119 minutes, point to upstream coordination issues that data-driven scheduling can mitigate
Staffing constraints (13%) with 197-minute average durations, highlight opportunities for smarter shift planning informed by actual machine demand patterns
Maintenance and cleaning (11%) averaging 85 minutes, can be optimized through better scheduling based on real utilization data
Each of these categories represents a concrete, addressable opportunity. The common thread across all of these categories: you need time-stamped, categorized data to move from anecdote to action.
Your implementation playbook: value in weeks, not years
Here's a practical six-step sequence that plant teams have used to go from zero visibility to actionable data without major IT involvement:
Phase |
What happens |
Timeline |
|---|---|---|
1. Define scope |
Pick 5–10 machines: known bottlenecks, debated assets, a mix of types |
Week 1 |
2. Align stakeholders |
Brief IT on the security posture (cellular connectivity, read-only, no network changes). Get operators bought in that this is about process improvement, not surveillance |
Week 1 |
3. Install sensors |
Clip CTs on motor leads, mount wireless sensors where needed. Most machines take under an hour |
Week 2 |
4. Configure and tune |
Set machine profiles, run/idle thresholds, shift schedules. Iterate based on what operators see on dashboards |
Weeks 2–3 |
5. Embed in daily routines |
Use monitoring data in daily production huddles. Have operators tag downtime reasons. Review shift-over-shift comparisons weekly |
Weeks 3–4 |
6. Scale what works |
Expand to additional lines using standardized install templates. Compare performance across machines and sites |
Ongoing |
The key principle: start with your biggest question marks, prove value fast, then self-fund expansion through the throughput and uptime gains you uncover. Based on Guidewheel's customer data, payback on plug-and-play monitoring pilots often arrives within months — particularly when teams act quickly on the short stops and changeover overruns that surface in the first few weeks. (Source: Guidewheel's Customer Research)
Start seeing what your machines are actually doing
If you're managing a floor full of mixed-age equipment with limited controls visibility, you don't need a multi-year digital transformation to start improving. You need a baseline: objective, machine-level data that tells you what's actually happening across every shift, every line, and every asset.
Guidewheel makes this practical. Clip-on sensors work on all equipment, from decades-old presses to brand-new lines. Cellular connectivity means no IT infrastructure changes. And proprietary algorithms turn simple current signals into the run/idle/down state data, OEE metrics, and condition signals your team needs to drive real improvement.
We had our best month of the year, increasing production from 26k–35k cases/month to 46k cases in March. I attribute this to Guidewheel. Being able to see downtime data and address downtime reasons directly correlates to higher production.
Michael Palmer, VP of Operations, Direct Pack
Ready to find the hidden capacity on your floor? Book a demo and see how fast your team can go from invisible machines to data-driven decisions.
💡
Frequently asked questions
How can I monitor machines that don't have a PLC or don't expose PLC data?
Clamp-on current transformer sensors bypass PLC dependency entirely. They read the electrical current flowing through a motor's power cable from the outside, using the current signature to determine whether the machine is running, idle, or stopped. An edge device processes these signals and sends machine state data to a cloud dashboard, giving you run/stop timelines, cycle counts, and utilization metrics without ever touching the machine's internal controls.
Can machine monitoring work without IT or OT network integration?
Yes. Many plug-and-play monitoring systems use dedicated cellular connections to transmit data directly to the cloud, completely bypassing your corporate network. This means no firewall changes, no server provisioning, and no new software on corporate devices. IT's role is limited to a lightweight security review of the solution's architecture rather than a full integration project.
What data can clip-on current sensors reliably capture?
Current sensors reliably detect run/idle/off states, transition timestamps, cycle counts (on machines with repetitive motion patterns), and load profiles. When paired with operator-entered reason codes for downtime events, they support full Availability and Performance calculations for OEE. For quality data, most teams supplement with manual scrap entries or integration with existing quality tracking systems.
Is current sensing accurate enough for real manufacturing decisions?
For distinguishing between running and stopped states, current sensing is highly reliable because the difference in electrical draw between an active motor and an idle or off motor is large and consistent. Accuracy challenges only arise in edge cases, such as machines with motors that run constantly regardless of production status. In those situations, adding a complementary sensor like a part-detection proximity switch or vibration sensor resolves ambiguity.
How quickly can a manufacturer see ROI from retrofit machine monitoring?
Many plants report meaningful payback within the first few months of deployment. The fastest wins typically come from surfacing previously invisible short stops and changeover overruns that accumulate into significant lost capacity. Even a modest improvement in utilization — say, moving from 60% to 65% effective uptime on a bottleneck asset — can translate into substantial throughput gains when multiplied across shifts and operating days.
About the author
Lauren Dunford is the CEO and Co-Founder of Guidewheel, a FactoryOps platform that empowers factories to reach a sustainable peak of performance. A graduate of Stanford, she is a JOURNEY Fellow and World Economic Forum Tech Pioneer. Watch her TED Talk—the future isn't just coded, it's built.

