No items found.
blog
Guidewheel New Features and Tips & Tricks: January
By: Guidewheel
Updated:
February 1, 2025
4 min read

As we kick off 2025, we’re here to help you keep improving. From new features to industry insights, here’s what’s in store this month:
- FactoryOps Findings: Blow molding insights from 2024, how does your plant compare?
- What's New: View your operations at a glance with the Plant Pulse map
- Tips & Tricks: Drive continuous improvement with daily cycle time reports
- Upcoming Events: Meet us at MD&M in Anaheim, CA on Feb 4-6!
As always, reach out to us at support@guidewheel.com with any questions.
FactoryOps Findings
Blow molding edition
Introducing FactoryOps Findings. This January 2025 update shares anonymized findings from Guidewheel customers to help teams compare their own performance and investigate potential improvements.
In our 2024 analysis of runtime across customers with blow molders on Guidewheel, here’s what we found:
- Average runtime: 77%
- Average downtime: 23%
How do your machines compare? Review the measurement definitions and your own operating context before drawing a conclusion from a benchmark. The playbooks below can help structure that discussion.
Share our Guidewheel playbooks with your teams to explore actionable ways to improve performance.
Have a specific machine or metric you’d like us to explore? Reply to this email with your request, it might be featured next month!
What's new?
💡 New feature release: View your entire operations at a glance with Plant Pulse
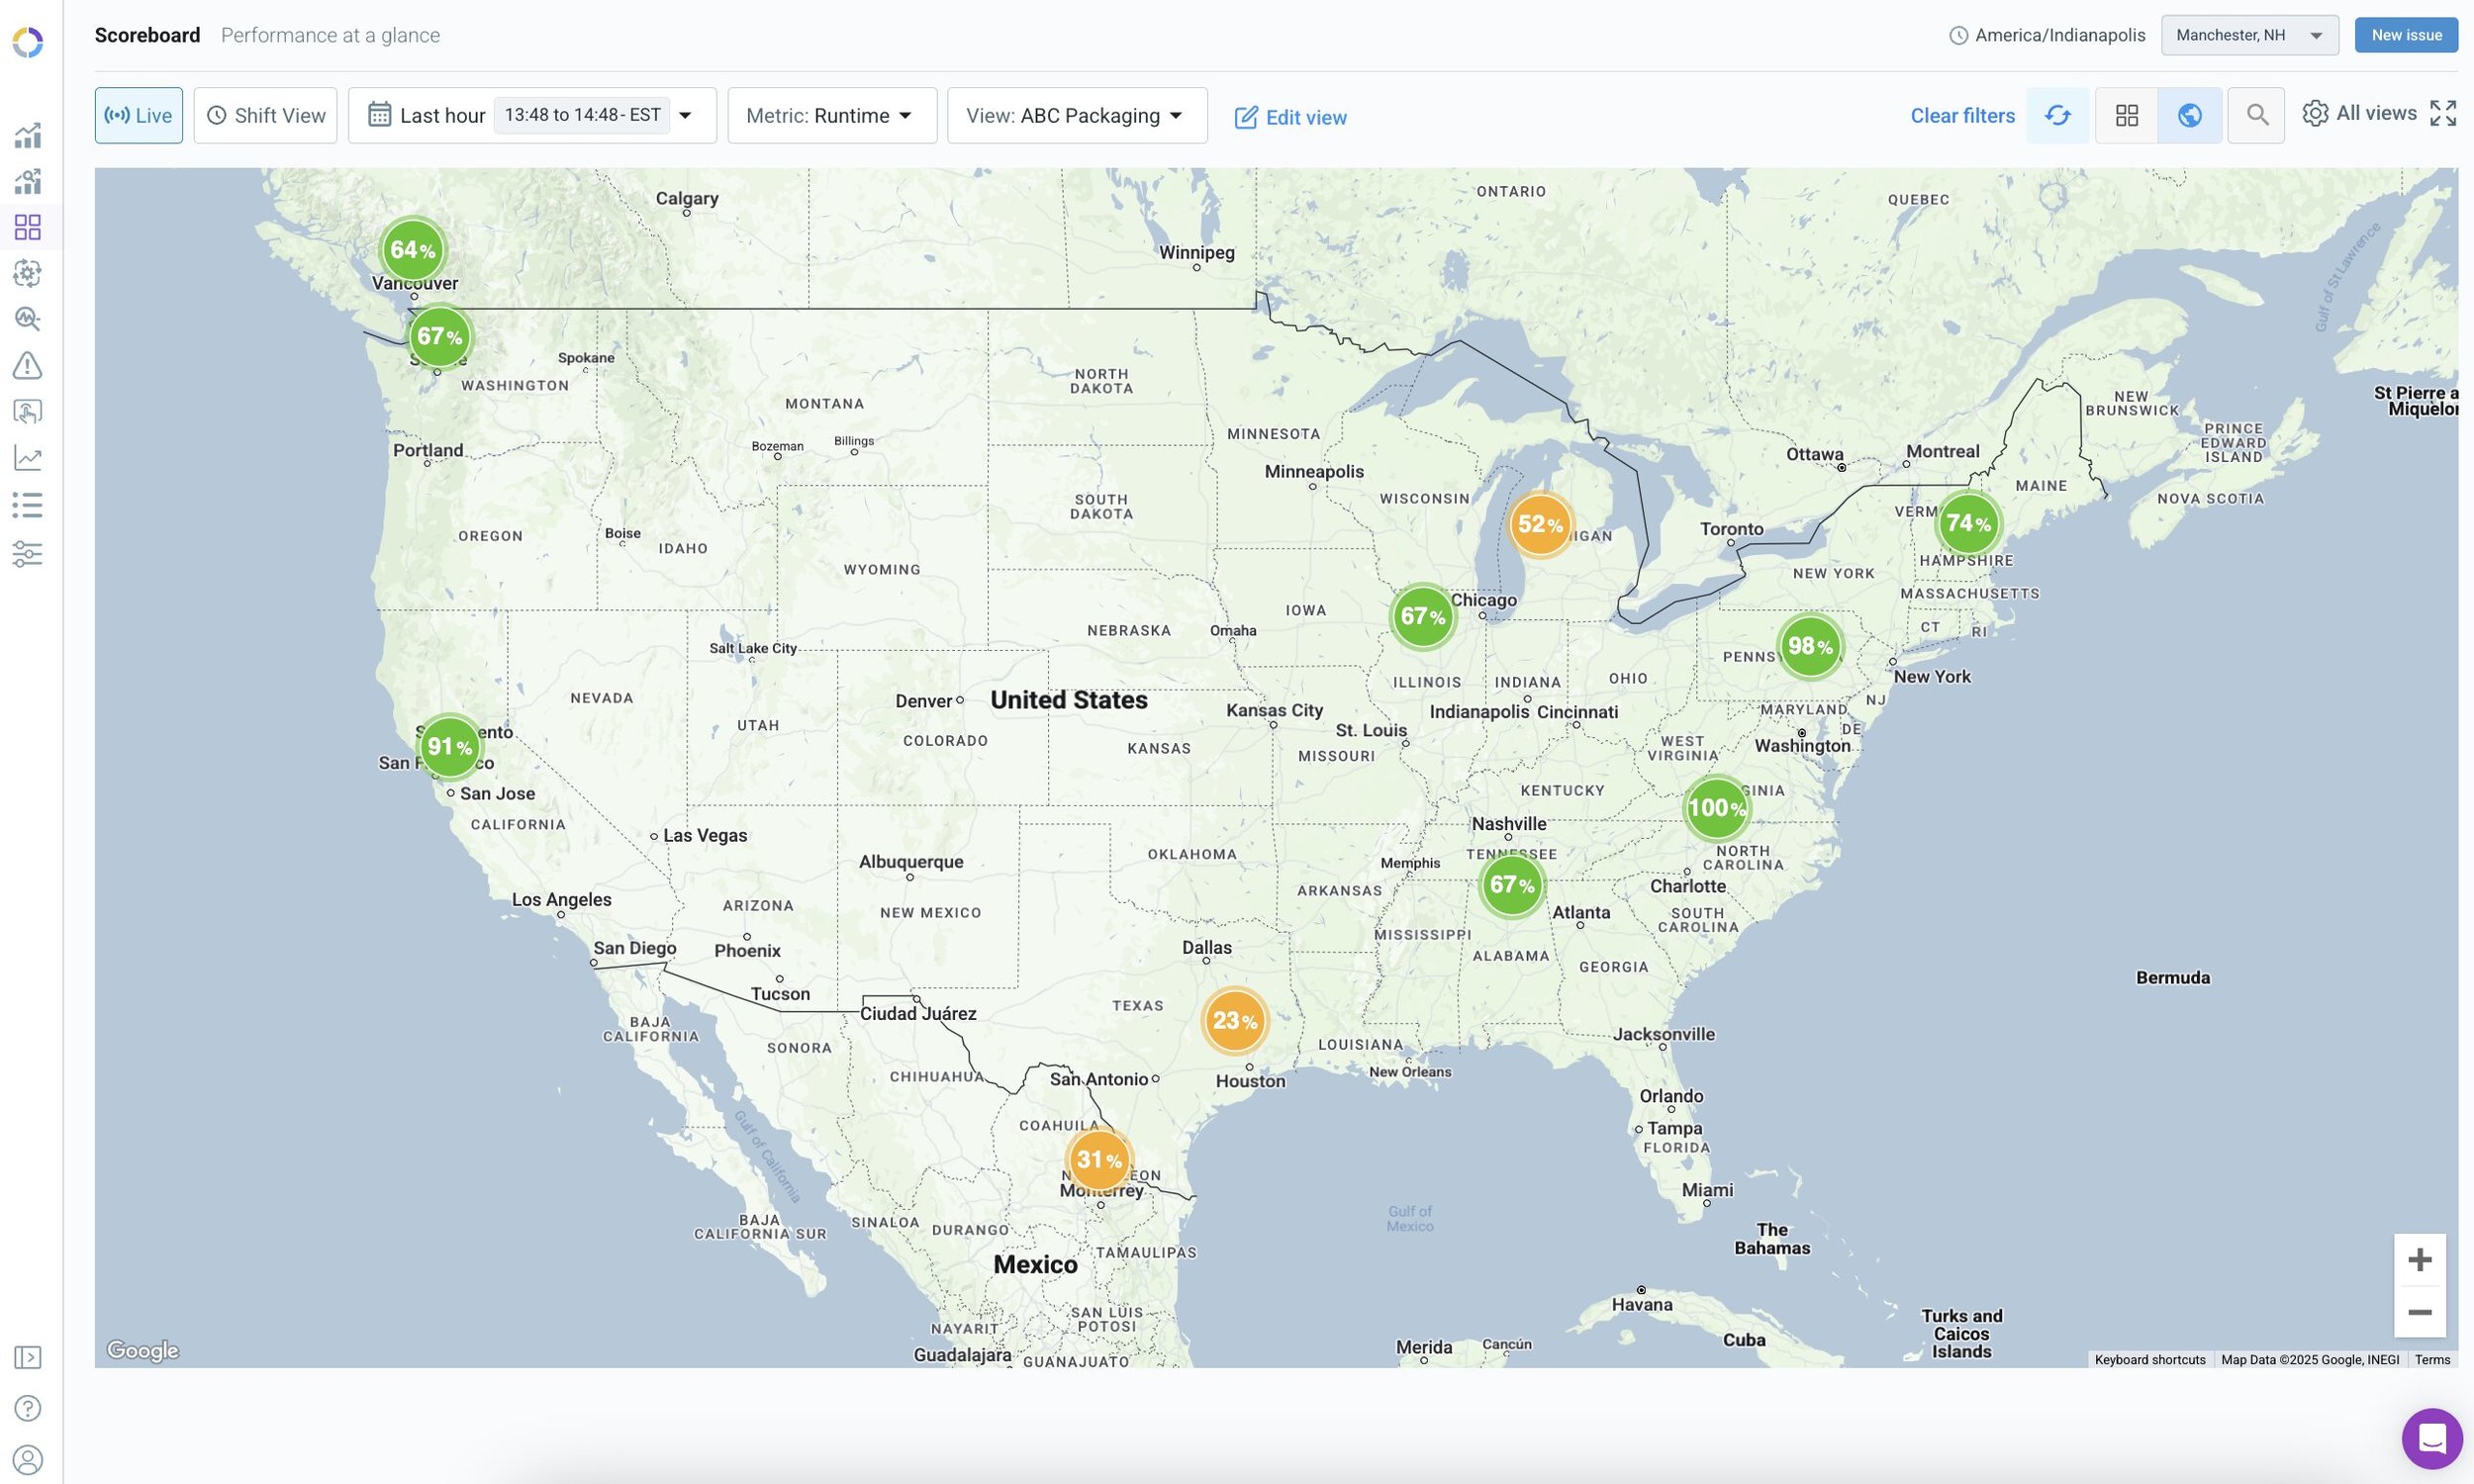
From the Scoreboard page, you can now toggle to the Plant Pulse map to view real-time runtime performance across all your plants. Use the map to identify a plant worth investigating, then open its machine data to understand what changed.
Now, operational leaders can:
- Compare performance across locations on one shared record
- Spread what works at one plant to every plant
- Make faster calls on capacity, shifts and moving work between plants
💡 Feature highlight: Easily organize machines by plant to improve teamwide visibility
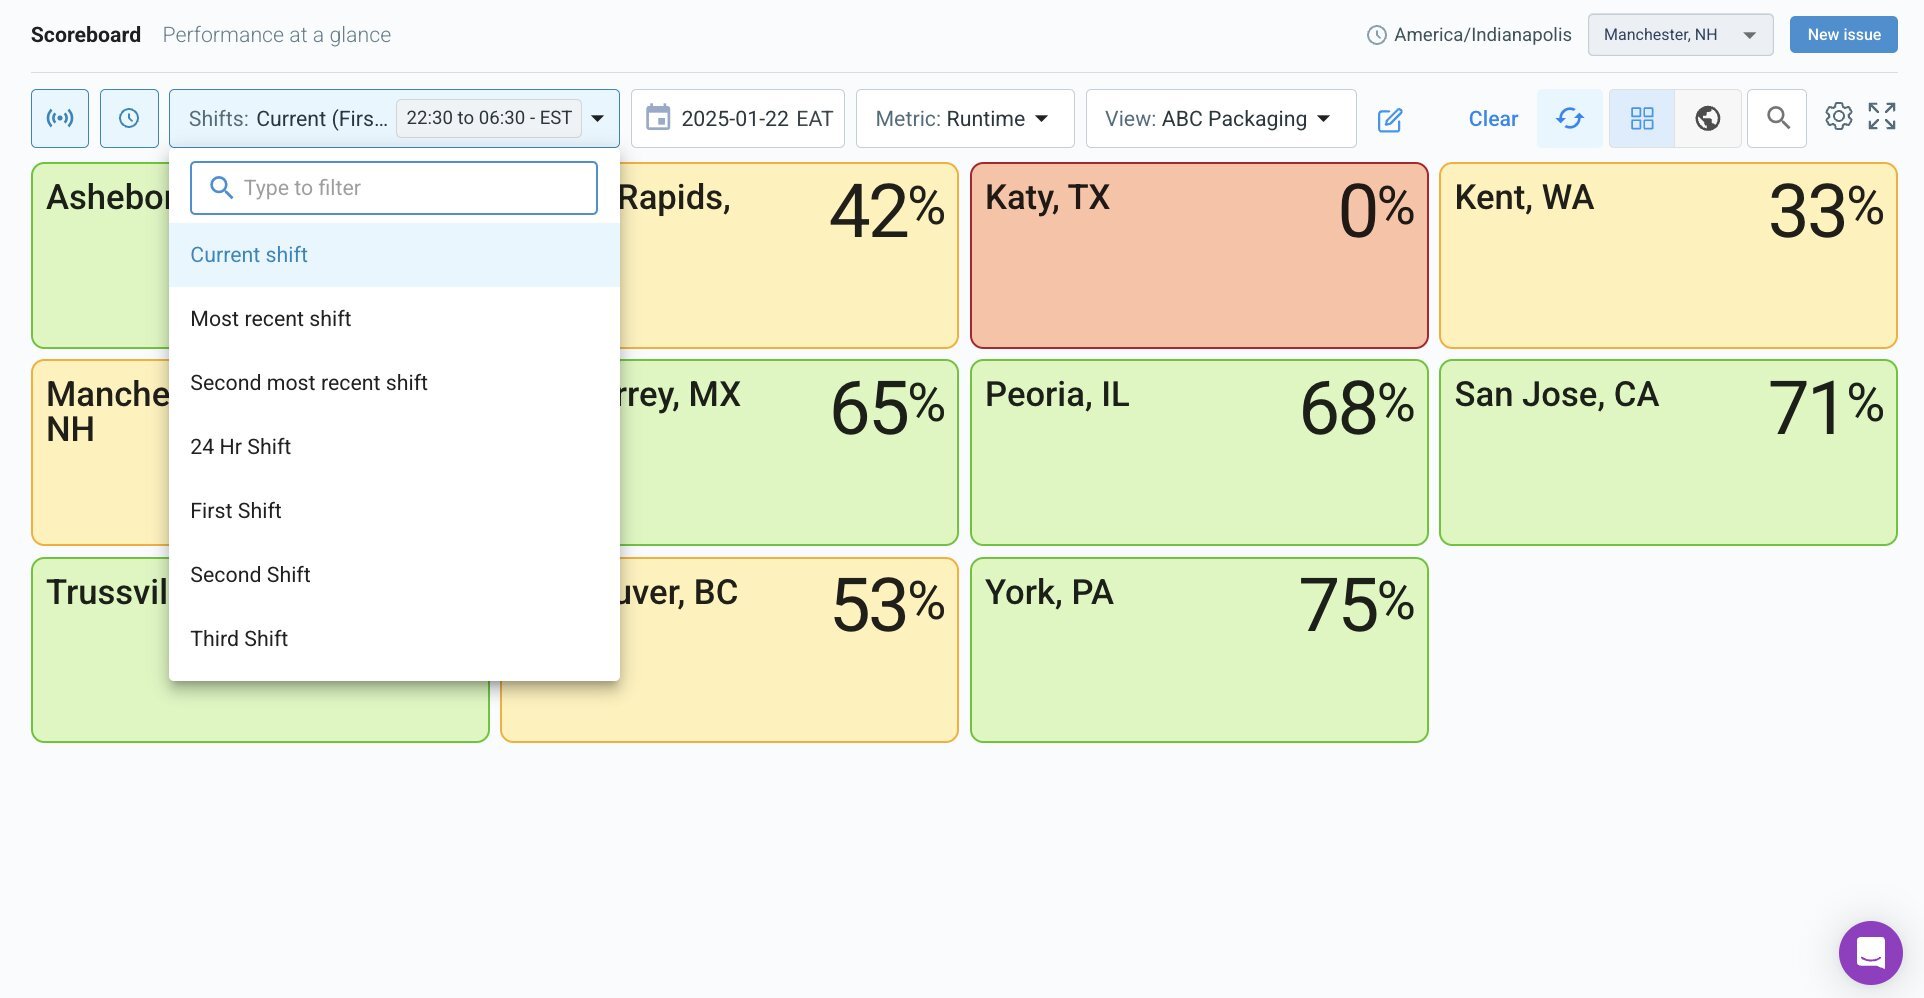
Group machines by physical location and apply the appropriate shift schedules, users and tags to each plant. This organizes a multi-site view without assuming the same operating targets suit every process.
Organizing your machines into plant allows you to:
- Track current shift performance in Scoreboard
- Streamline multi-plant reporting
- Take advantage of the Plant Pulse map
- Coming soon: Proactively adjust production schedules
Tips & Tricks
👋 Pro-tip: Drive continuous improvement with daily cycle time reports
Did you know you can add cycle data to your automated email reports? Many Guidewheel customers use email reports to track cycle performance after shifts to understand where they’re leading and lagging in throughput. Learn more
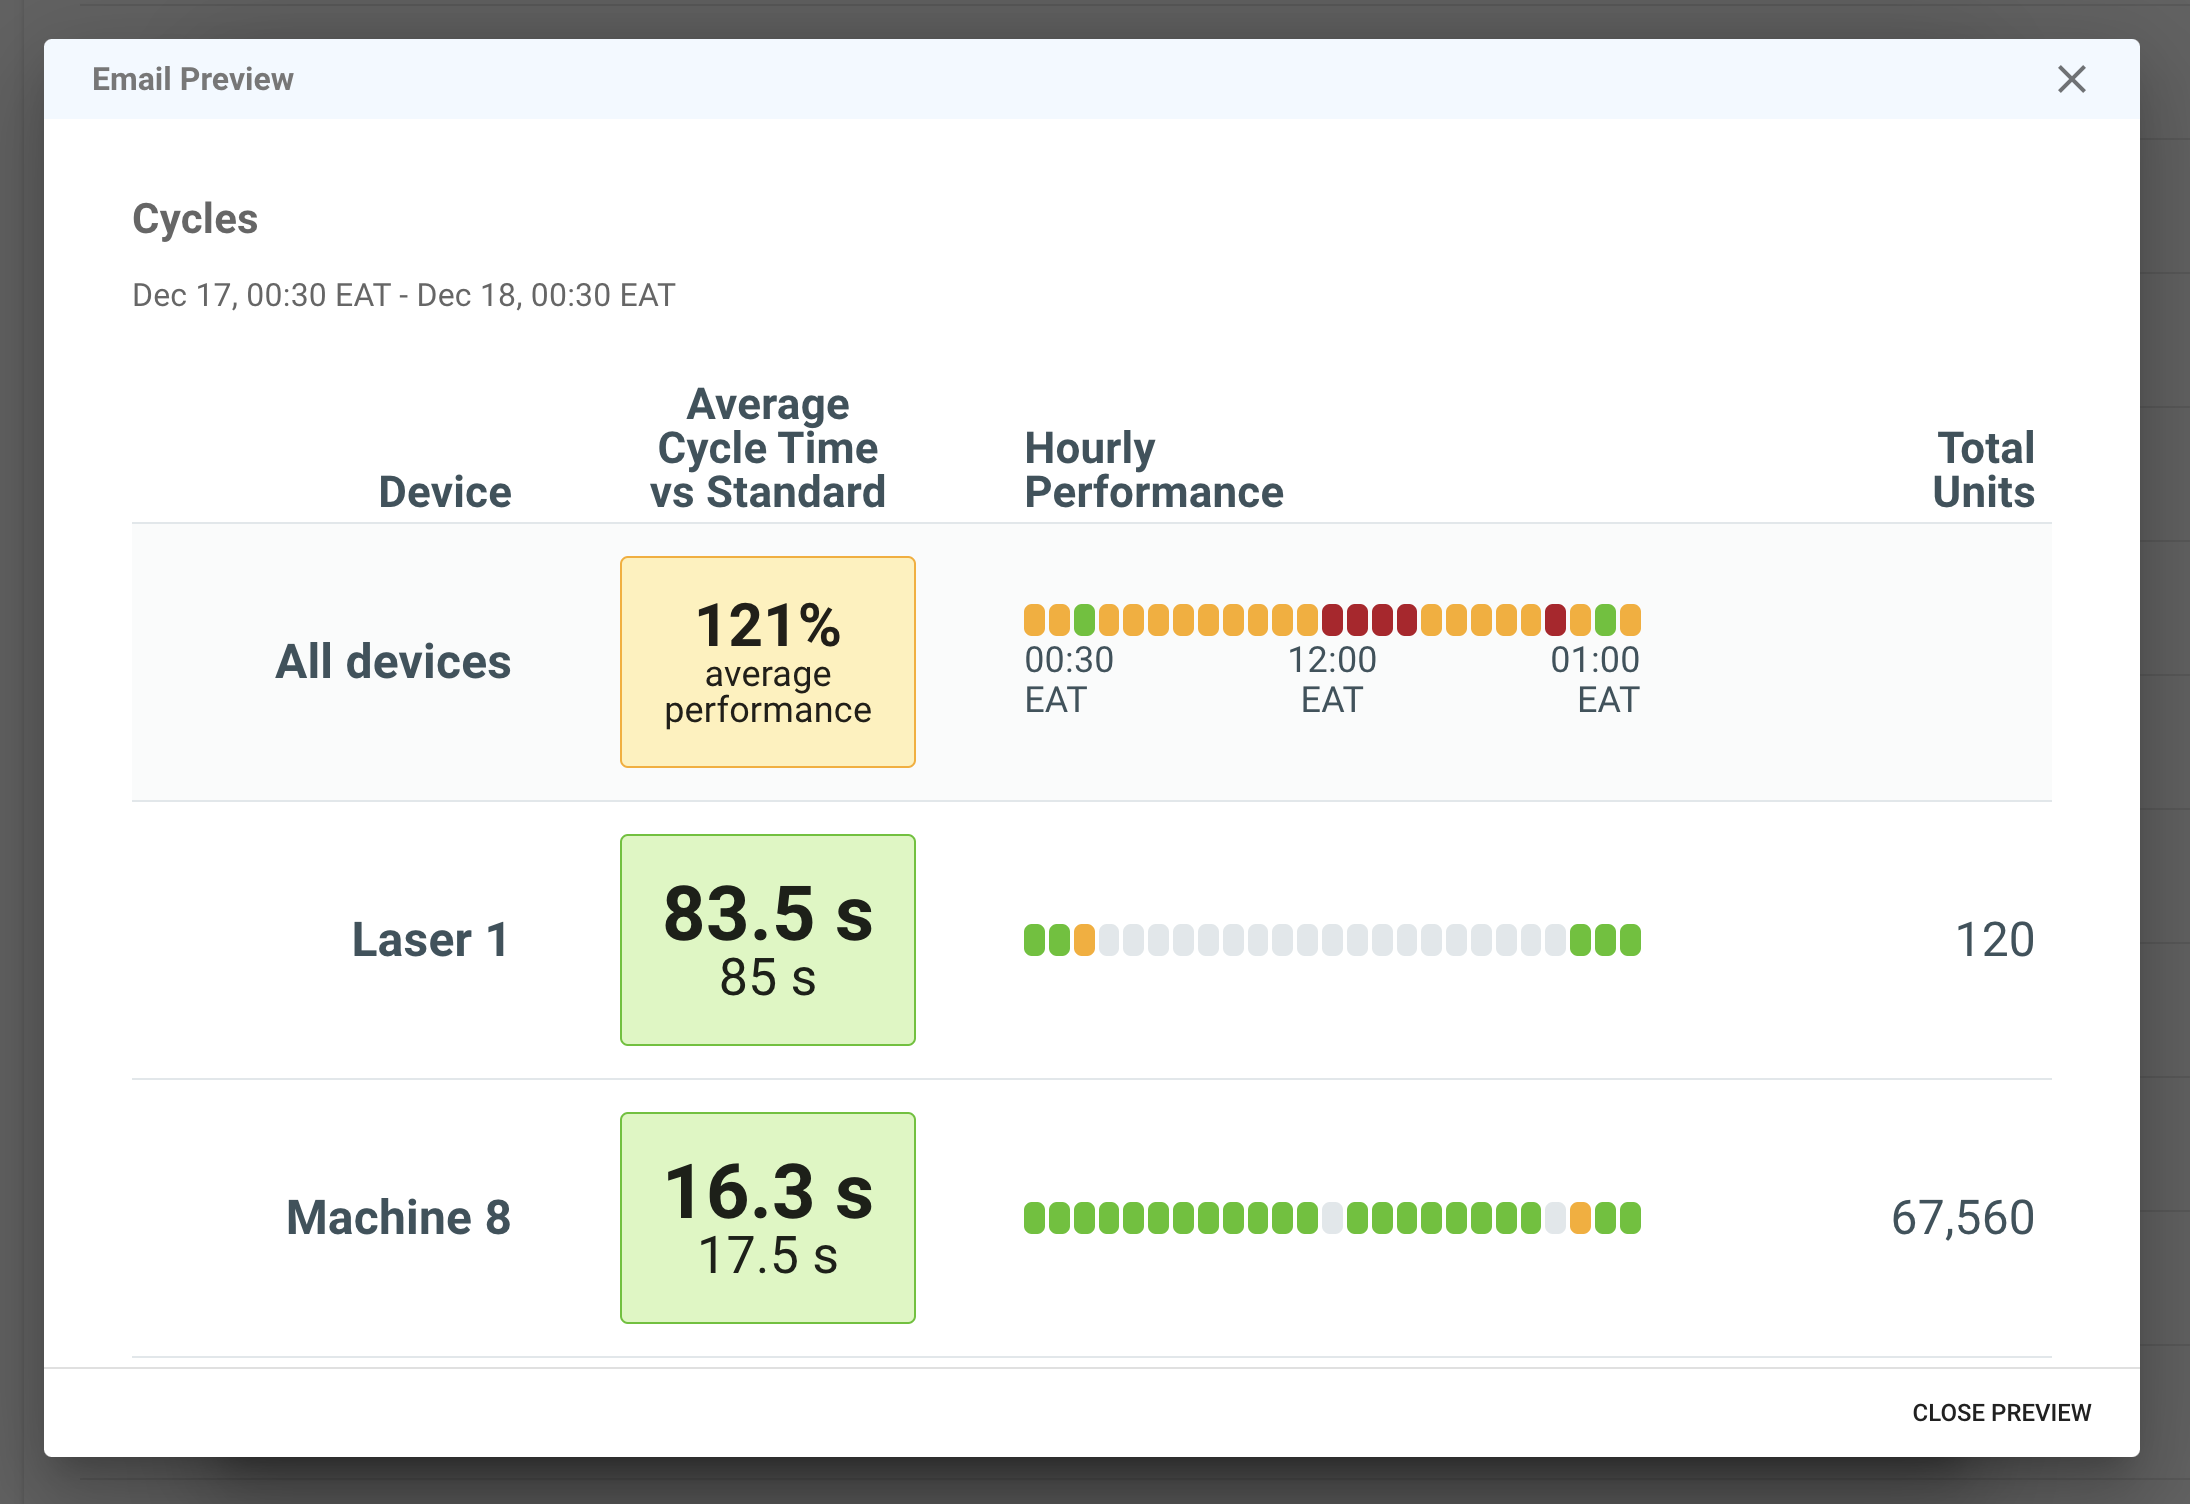
The original update describes Cycle Time reports as a Premium License feature. Ask your Guidewheel representative about current access and setup.
News
✈️ Say hi to the Guidewheel team at the following events
- Feb 4-6:
MD&M West - Anaheim, CA
Feb 5-6: Food Processing Expo - Sacramento, CA
Mar 18-20: Plastics Technology Expo (PTXPO) - Rosemont, IL
Mar 19-20: American Manufacturing Summit - Chicago, IL
Will we see you there? Let us know if you’d like to meet up!
🤝 Walmart Panel
Guidewheel was thrilled to join leaders from Walmart, Igloo, and Berry Global to discuss innovation in manufacturing.
🌎 World Economic Forum
Lauren Dunford, co-founder and CEO, was honored to speak on World Economic Forum panels in Davos.
For current product capabilities and help applying a playbook, contact your Guidewheel team or book a demo.