No items found.
blog
Industry Report: Blow Molding Machine Maintenance and OEE Tracking in Plastics Packaging Lines 2026
By: Guidewheel
Updated:
December 19, 2025
9 min read

In the high-volume world of plastics and packaging, operational efficiency isn't just a metric—it is the difference between profitability and stagnation. For plant managers and operations directors, the pressure to deliver higher throughput while managing aging equipment and tight margins is constant. While many facilities rely on gut feeling or manual logs to track performance, the industry is shifting toward a more empirical, data-driven approach to maintenance and Overall Equipment Effectiveness (OEE).
This report moves beyond theoretical best practices to analyze hard performance data. By examining the actual operational realities of blow molding machinery, we establish a clear baseline for what "good" looks like in 2026 and identifying where the hidden capacity lies in your existing production lines.
Scope of the Analysis
To provide actionable benchmarks rather than generic estimates, this report relies on empirical data collected directly from the shop floor. The insights below are based on Guidewheel’s sensors over the last few months, between September and November 2025.
This dataset focuses specifically on blow molding operations within the plastics and packaging sector. It is important to note that this analysis reflects the performance of the specific facilities and machines covered by the sensor data (based on 14.5 million machine-minutes from hundreds of blow molding machines) and serves as a representative sample of the industry. These findings provide a data-backed reference point for plant leaders looking to benchmark their own operations against peer performance in the current market.
The Performance Gap in Blow Molding Operations
When evaluating machine performance, average numbers often hide the true story. To understand the potential of your equipment, it is necessary to look at the spread between the median performers and the top-tier facilities.
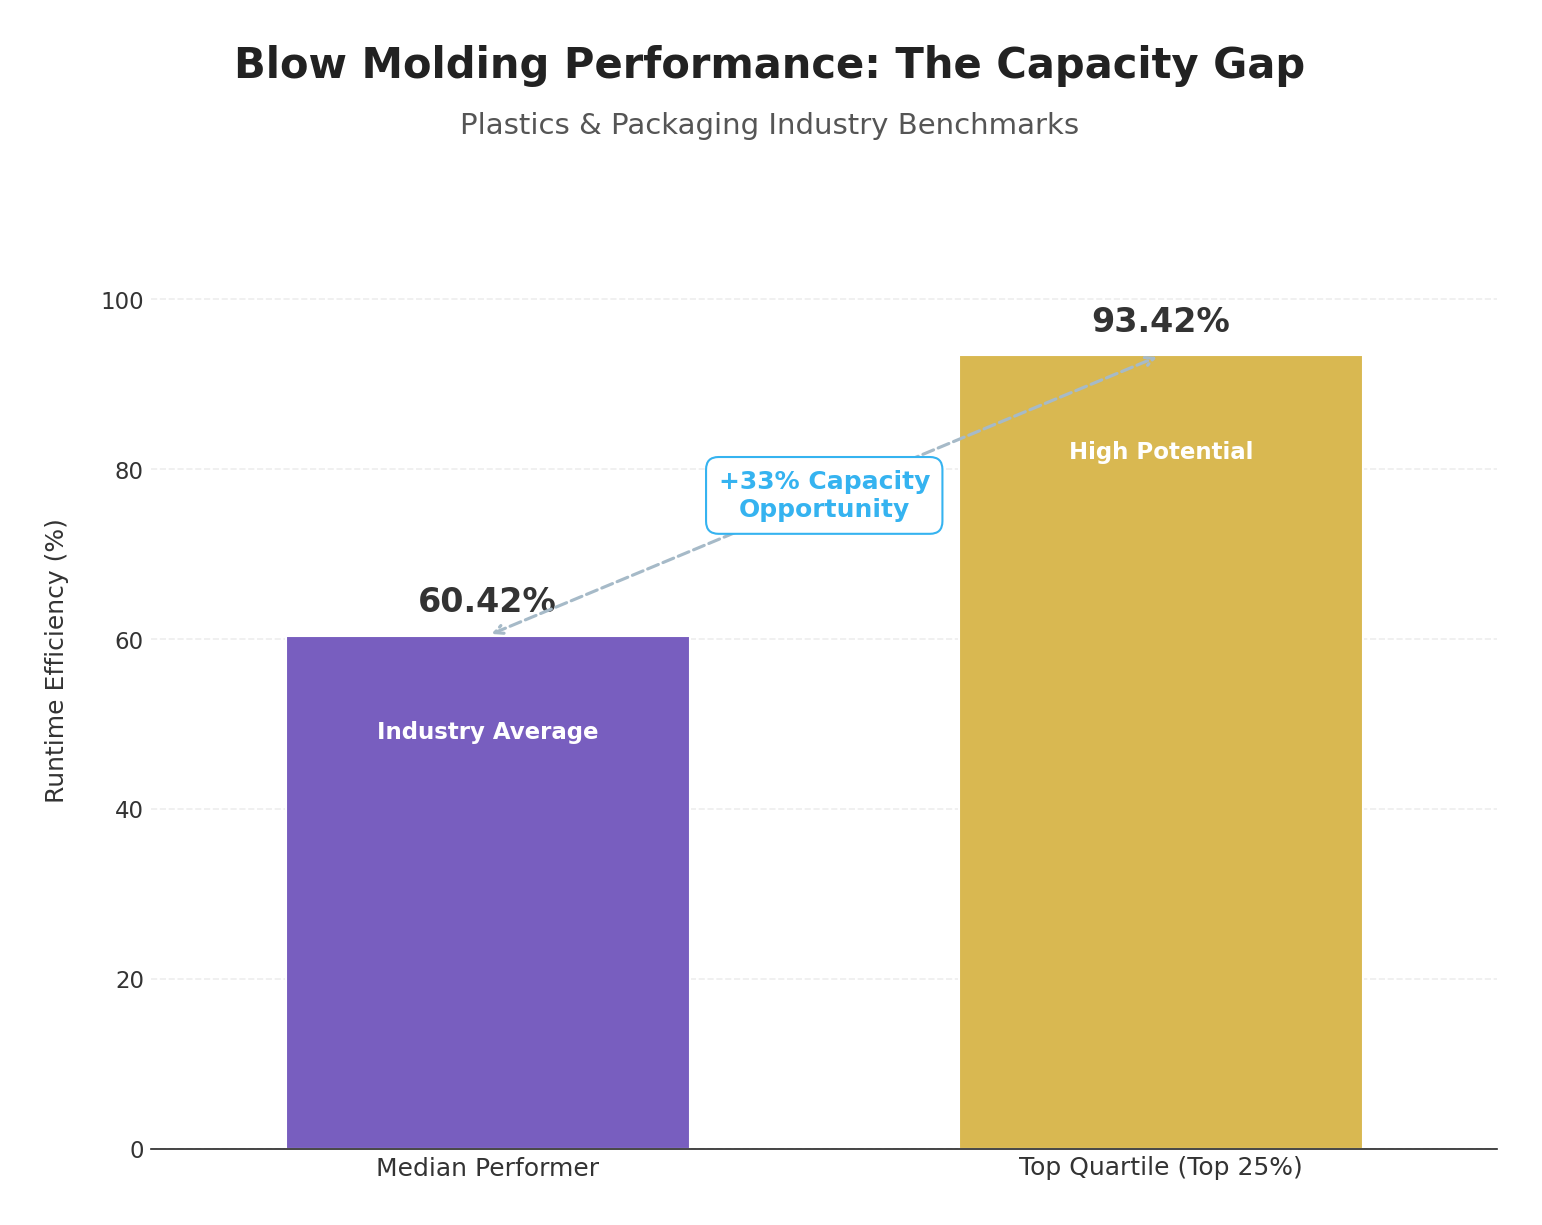
Recent performance data reveals a significant gap in asset utilization within the plastics and packaging sector.
Median Runtime: 60%
Top Quartile (Top 25%) Runtime: 93%
Performance Gap: 33%
(Source: Guidewheel Performance Analysis)
The data indicates that the median blow molding machine is running value-added production only 60% of the time. However, the top 25% of machines are achieving 93% runtime. This 33% gap represents "hidden factory" capacity—production potential that exists within your current assets but is currently lost to inefficiencies, changeovers, or unplanned downtime.
For a plant manager, this benchmark serves as a powerful reference point. If your utilization is hovering around 60%, you are in line with the industry average, but the data proves that your equipment is capable of significantly higher output without capital investment in new machinery.
(Source: Guidewheel Performance Analysis, n=14.5 million machine-minutes)
Analyzing the Real Drivers of Downtime
To improve uptime, we must first understand exactly why machines stop. While "No Business/Orders" is often the largest statistical category for downtime, it is an external market factor. For maintenance and operations teams, the focus must be on the controllable operational losses.
The data highlights four primary operational downtime categories that offer the most immediate ROI for improvement efforts.
1. Maintenance & Cleaning
Impact: 11% of total downtime
Average Duration: ~209 minutes (3.5 hours)
(Source: Guidewheel Performance Analysis)
This is the most significant operational loss driver. These events are often reactive—cleaning a jammed extruder or fixing a hydraulic leak. The long average duration (over 3 hours) suggests that when blow molding lines go down for maintenance, they stay down. Moving from reactive repairs to predictive maintenance can drastically cut this duration.
2. Other Operational Stops
Impact: 9% of total downtime
Average Duration: ~118 minutes
(Source: Guidewheel Performance Analysis)
This category captures the cumulative impact of frequent stops—start-ups, minor adjustments, and miscellaneous interruptions. While less severe than major breakdowns, these stops disrupt the thermal stability of the blow molding process, often leading to scrap upon restart.
3. Mechanical Breakdowns
Impact: 6% of total downtime
Average Duration: ~62 minutes
(Source: Guidewheel Performance Analysis)
Mechanical failures in this sector are frequent but typically shorter in duration than general maintenance events. This suggests facilities are dealing with common, repeatable issues—worn belts, sensor errors, or air valve failures—that could be preempted with better condition monitoring.
4. Staffing-Related Downtime
Impact: 5% of total downtime
Average Duration: ~202 minutes
(Source: Guidewheel Performance Analysis)
Staffing issues result in long-duration downtime similar to maintenance events. When an operator is unavailable, the machine sits idle. In the current labor market, staffing shortages are a reality for many facilities. This highlights the need for systems that allow fewer operators to monitor more machines effectively, rather than relying on 1:1 machine-to-operator ratios.
Cross-Industry Benchmarks: Contextualizing Blow Molding Performance
It is valuable to compare how blow molding assets in Plastics & Packaging perform relative to other sectors. This context helps validate whether your operational targets are realistic for your specific industry conditions.
Industry Sector | Median Runtime | Changeover Duration (Median) |
|---|---|---|
Plastics & Packaging | 60% | 45 min |
Chemicals & Related | 3% | 64 min |
Other Industries | 85% | N/A |
(Source: Guidewheel Performance Analysis)
Key Takeaways:
High Velocity Requirement: Plastics & Packaging blow molders run at 60% median utilization, vastly outperforming sectors like Chemicals (3%). This confirms that plastics manufacturing is a high-velocity environment where uptime is critical.
Faster Changeovers: The pressure for throughput drives faster changeovers in plastics (45 min) compared to chemicals (64 min).
Room for Growth: While plastics outperforms some sectors, "Other Industries" achieve 85% median runtime, suggesting that higher efficiency is technically possible with the right operational rigor.
Bridging the Gap with Real-Time Monitoring
The data clearly identifies the problems: a 33% gap between average and top performers, massive inconsistency in changeover times, and significant time lost to reactive maintenance. The solution to these challenges lies in visibility. You cannot optimize what you do not measure in real-time.
Many facilities still rely on manual logs or clipboard tracking, which are lagging indicators. By the time you calculate OEE at the end of the week, the production hours are already lost. Closing the performance gap requires shifting to real-time, automated monitoring that provides immediate feedback to the plant floor.
The Role of Guidewheel in Operational Optimization
Guidewheel offers a factory operations platform designed specifically to address the visibility gaps identified in the performance analysis. Unlike complex MES implementations that require months of integration, Guidewheel utilizes a "clip-on" sensor approach that works on any machine, regardless of age or manufacturer.
Universal Compatibility: Whether you are running brand-new all-electric blow molders or legacy hydraulic machines from the 1990s, Guidewheel’s sensors clip around the power supply to pull data immediately. This bypasses the need for complex PLC integration.
Connectivity Flexibility: The system works securely over cellular networks, removing the need to involve IT departments or compromise facility firewalls, though it also supports standard internet connectivity if available.
FactoryOps Philosophy: The platform is built for the operator and plant manager, not just the data scientist. It focuses on "winning the shift" by providing real-time scoreboards that help teams spot micro-stops and slow cycles instantly.
By digitizing the heartbeat of the machine, Guidewheel addresses the specific pain points revealed in the data:
Reducing Variation: Real-time cycle time tracking helps standardize changeovers and reduce the 192% spread.
Targeting Maintenance: Automated downtime categorization highlights exactly which machines are suffering from the "Maintenance & Cleaning" losses, allowing you to deploy resources where they are needed most.
Empowering Teams: With clear visibility, operators can manage more assets effectively, mitigating the impact of staffing shortages.
Start Optimizing Your Operations
The benchmarks are clear: there is likely 30% or more hidden capacity in your existing blow molding lines. The difference between the median performance of 60% and the top-quartile performance of 93% is not better machinery—it is better visibility and faster reaction times.
Transforming your operation doesn't require a massive capital overhaul. It starts with getting the truth about your production floor.
About the Author
Lauren Dunford is the CEO and Co-Founder of Guidewheel, a FactoryOps platform that empowers factories to reach a sustainable peak of performance. A graduate of Stanford, she is a JOURNEY Fellow and World Economic Forum Tech Pioneer. Watch her TED Talk—the future isn’t just coded, it’s built.

