
Introduction
As we kick off 2025, we’re here to help you keep improving. From new features to industry insights, here’s what’s in store this month:
- Factory Ops Findings: Blow molding insights from 2024—how does your plant compare?
- What's New: View your operations at a glance with the Plant Pulse map
- Tips & Tricks: Drive continuous improvement with daily cycle time reports
- Upcoming Events: Meet us at MD&M in Anaheim, CA on Feb 4-6!
As always, reach out to us at support@guidewheel.com with any questions.
FactoryOps Findings
Blow Molding Edition
Introducing FactoryOps Findings! Each month, we’ll share anonymized insights from the thousands of machines and hundreds of customers we work with to help you benchmark your performance, learn about trends, and unlock new efficiencies.
In our 2024 analysis of runtime across customers with blow molders on Guidewheel, here’s what we found:
- Average Runtime: 77%
- Average Downtime: 23%
How do your machines compare? What processes have you implemented to support efficient, effective operations at your plants?
Share our Guidewheel playbooks with your teams to explore actionable ways to improve performance.
Have a specific machine or metric you’d like us to explore? Reply to this email with your request—it might be featured next month!
What’s New?
New Feature Release: View your entire operations at a glance with Plant Pulse
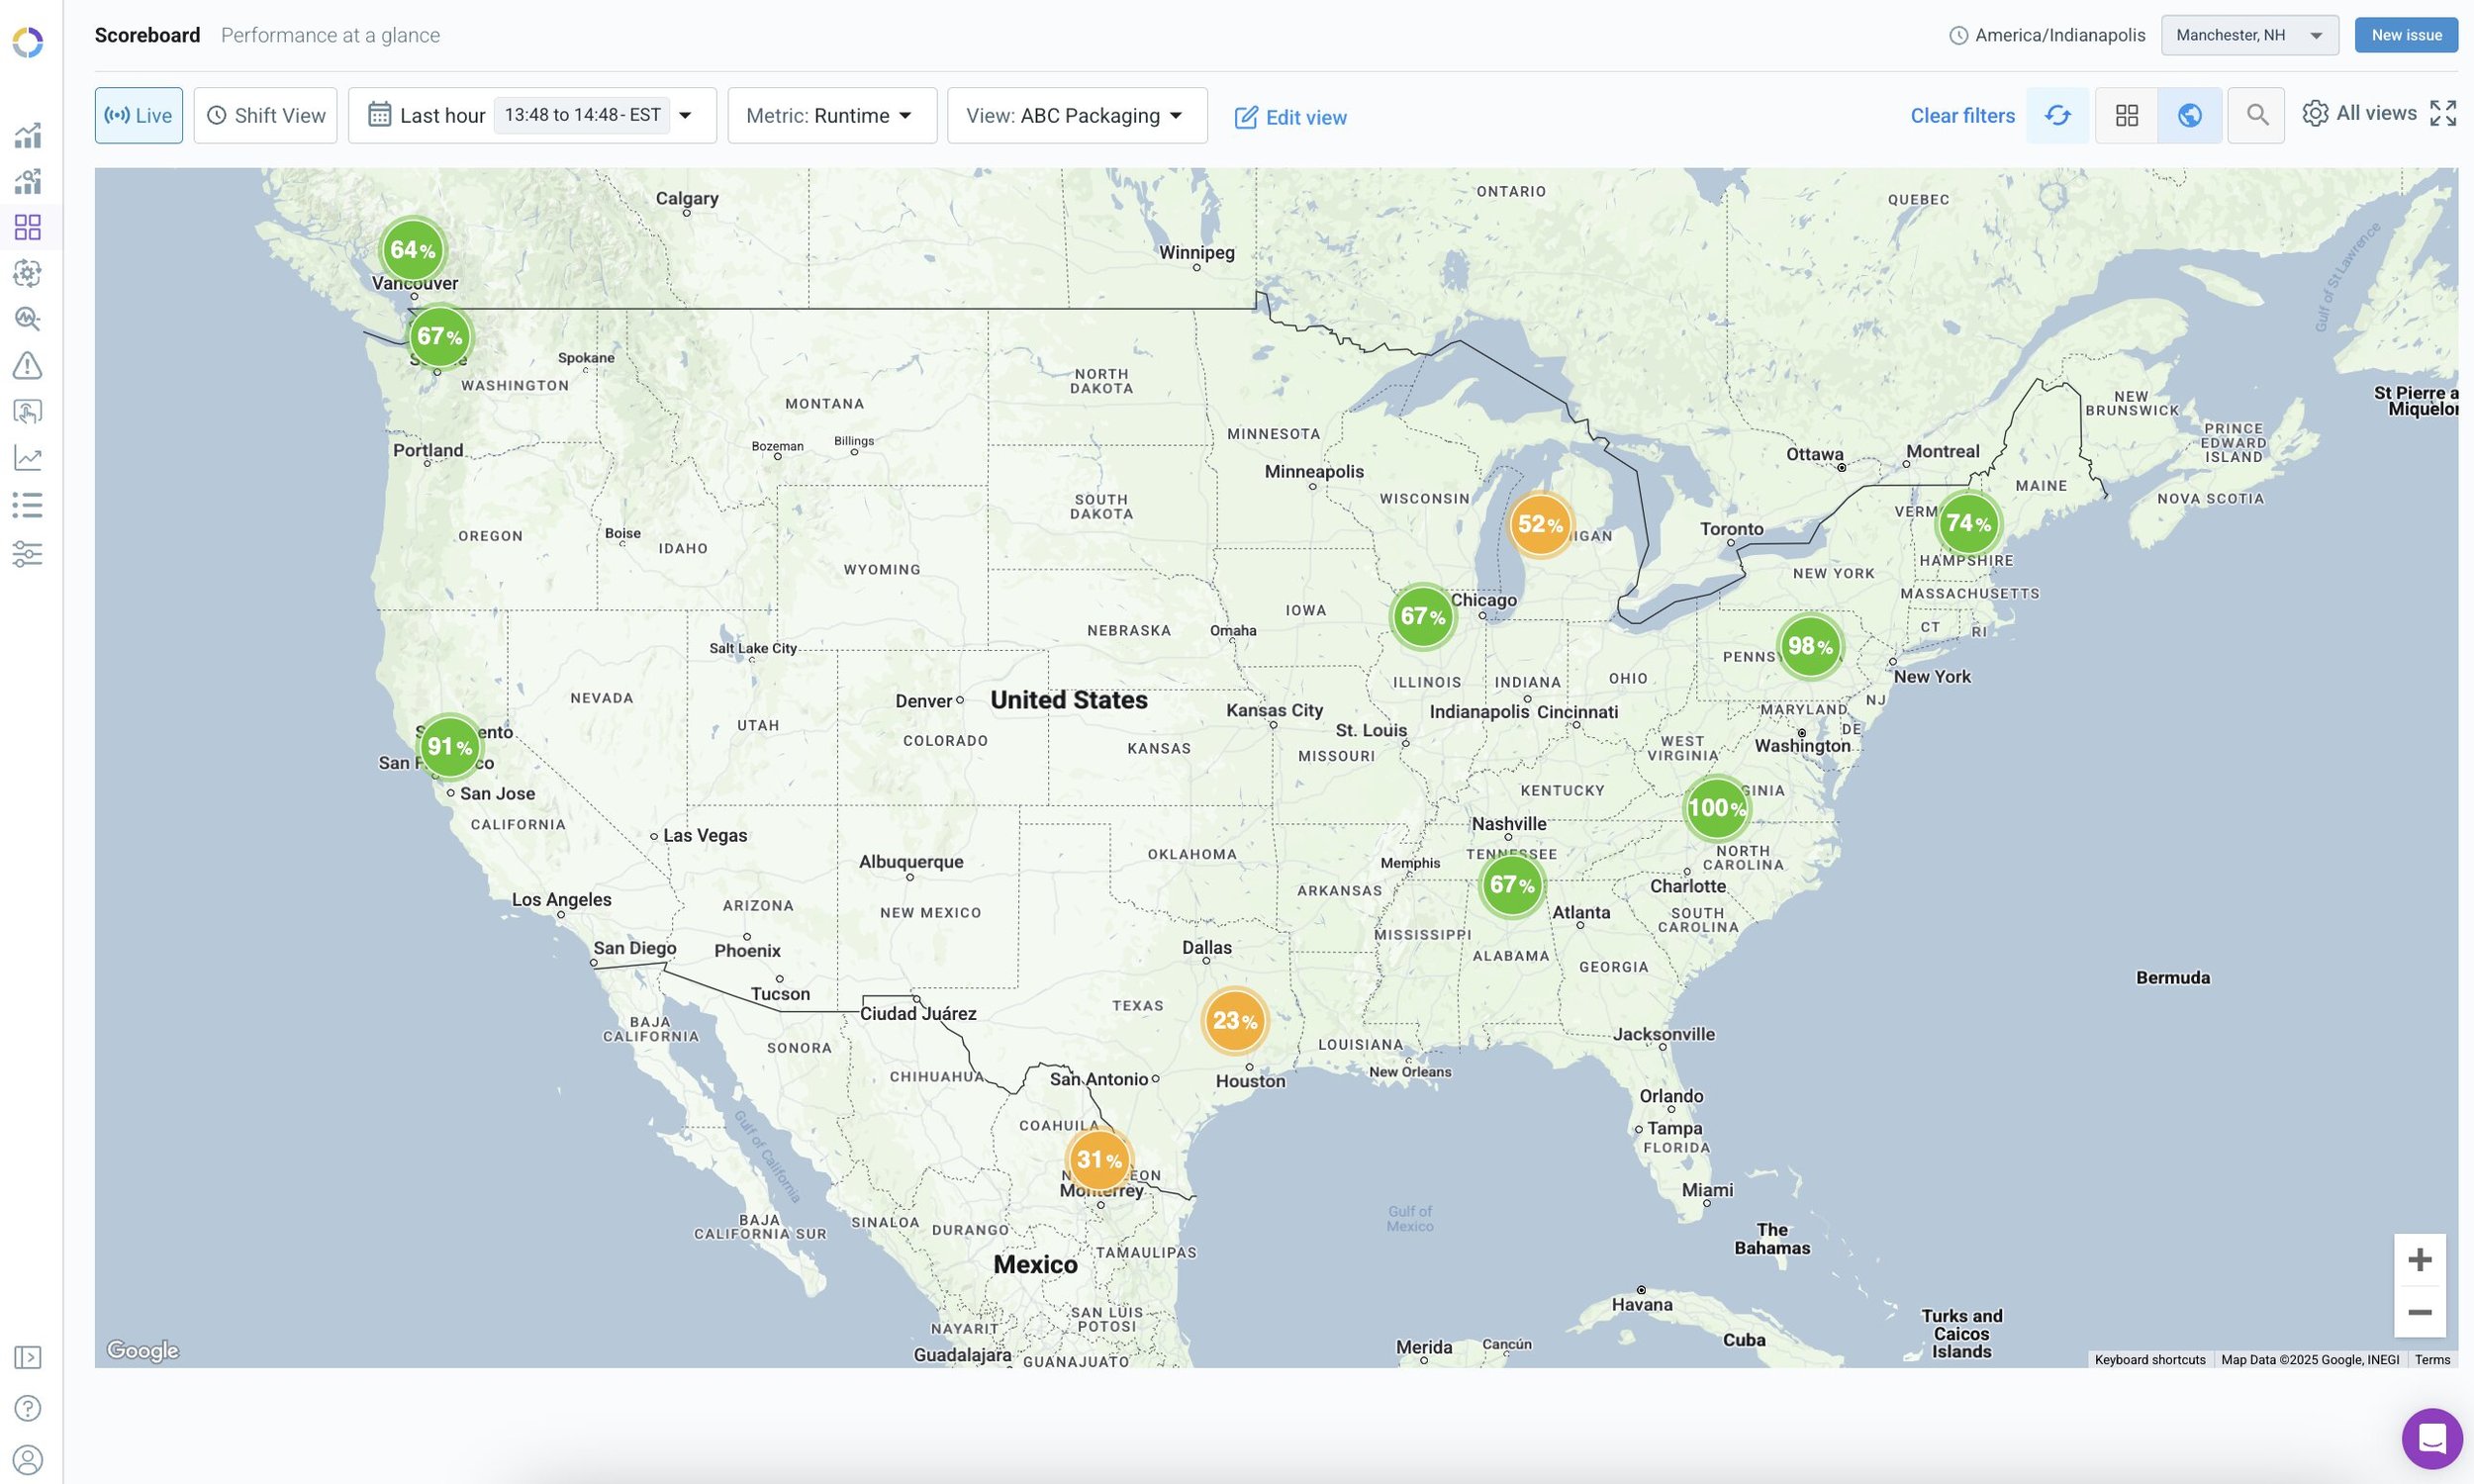
From the Scoreboard page, you can now toggle to the Plant Pulse map to view real-time runtime performance across all your plants. It’s the quickest way to spot issues and dive deep into any plant or machine.
Now, operational leaders can:
- Easily compare performance across locations
- Ensure every plant is performing at its full potential
- Solve problems before they escalate
New Feature Release: View your entire operations at a glance with Plant Pulse
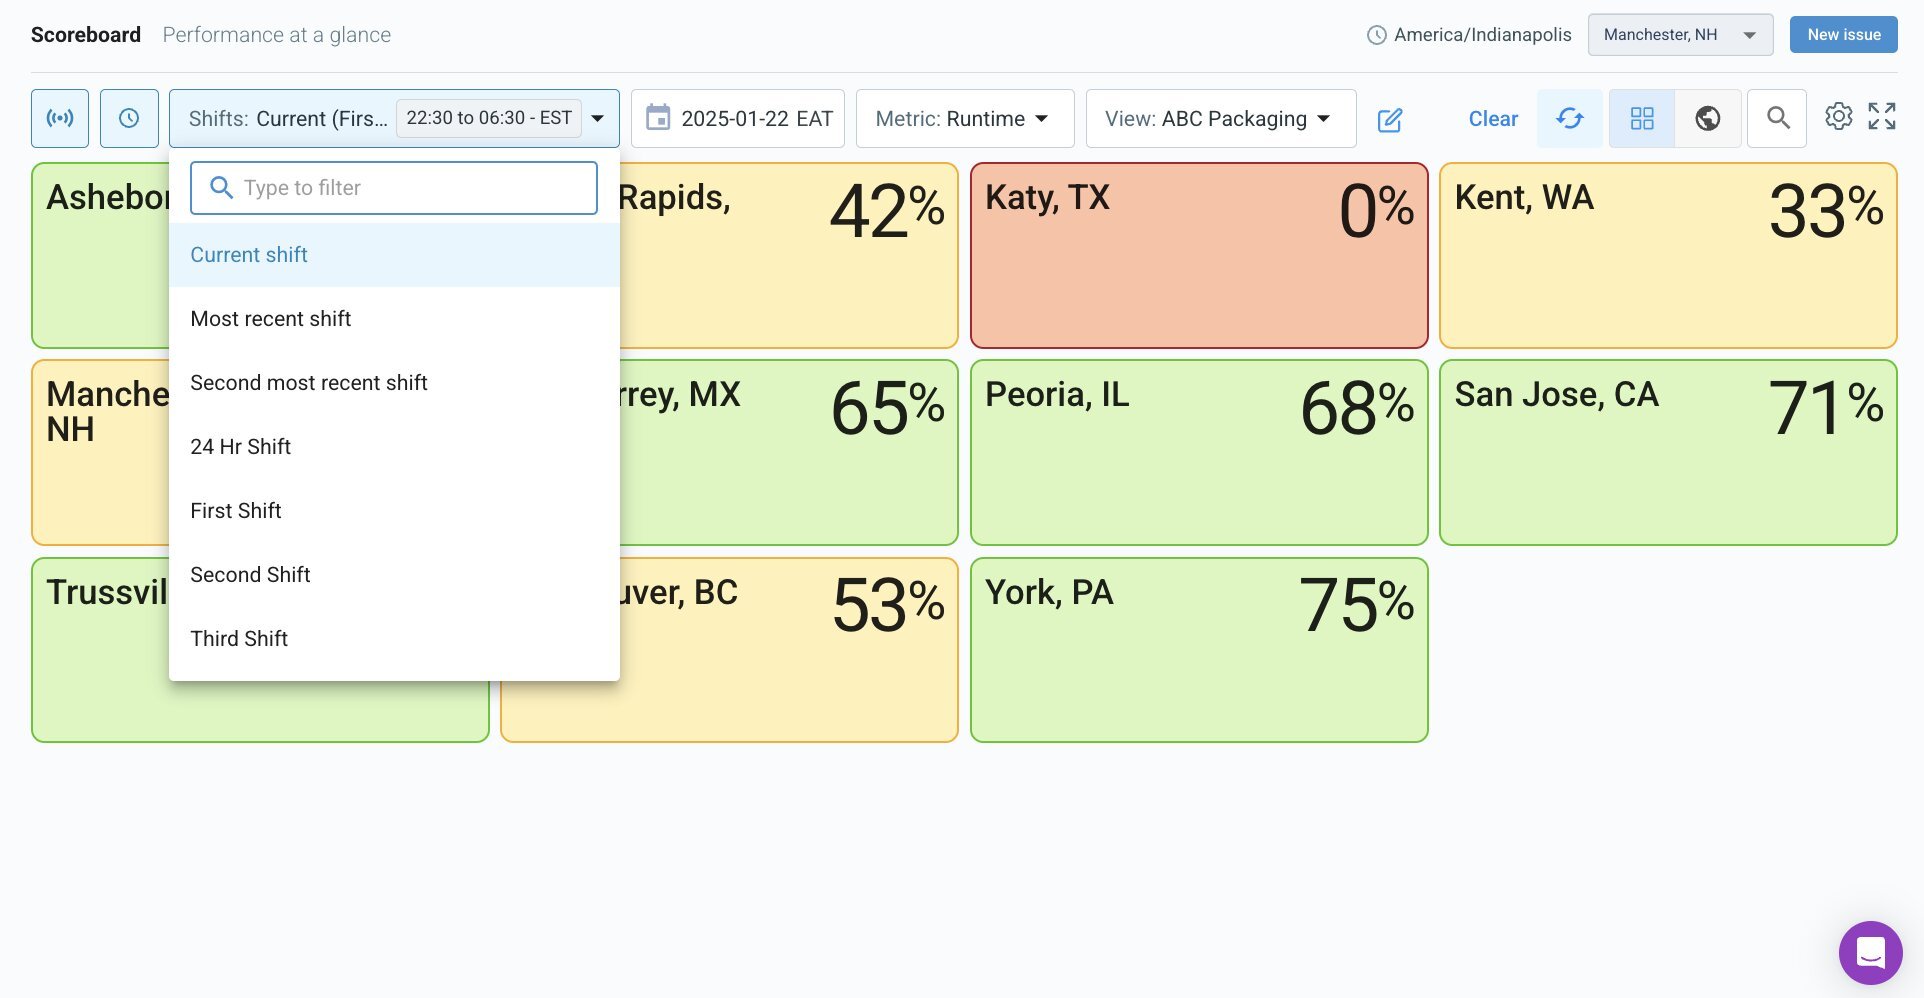
Many of our customers already group machines by type, location, and more using device lists. Now, you can also organize those machines into plants—making it easier to group machines by physical location and apply relevant shift schedules, users, and tags to each plant.
Organizing your machines into plant allows you to:
- Track current shift performance in Scoreboard
- Streamline multi-plant reporting
- Take advantage of the Plant Pulse map
- Coming Soon: Proactively adjust production schedules
Tips & Tricks
Pro-tip: Drive continuous improvement with daily cycle time reports
Did you know you can add cycle data to your automated email reports? Many Guidewheel customers use email reports to track cycle performance after shifts to understand where they’re leading and lagging in throughput.

Unlock the Cycle Time email report with a Premium License. Connect with your Guidewheel representative to learn more.
News
Say hi to the Guidewheel team at the following events
- Feb 4-6: MD&M West - Anaheim, CA
- Feb 5-6: Food Processing Expo- Sacramento, CA
- Mar 18-20: Plastics Technology Expo (PTXPO)- Rosemont, IL
- Mar 19-20: American Manufacturing Summit - Chicago, IL
Will we see you there? Let us know if you’d like to meet up!
In this Factory Forward webinar, Foster Taliaferro, Director of Technical Services at Arcosa Aggregates, joins Guidewheel CEO Lauren Dunford for a candid conversation on how real-time and predictive technology can empower frontline teams.
In this webinar, Guidewheel CEO Lauren Dunford shares how mid-sized manufacturers are getting real-time visibility into machine downtime—without the time, cost, or complexity of traditional systems.
It's inspiring to speak with other industry leaders and explore new ways to drive growth, improve efficiency, and reduce emissions for our customers.

