No items found.
blog
How Rotational Molding Asset Monitoring is Transforming Consumer Goods Production Efficiency in 2026
By: Guidewheel
Updated:
December 19, 2025
9 min read
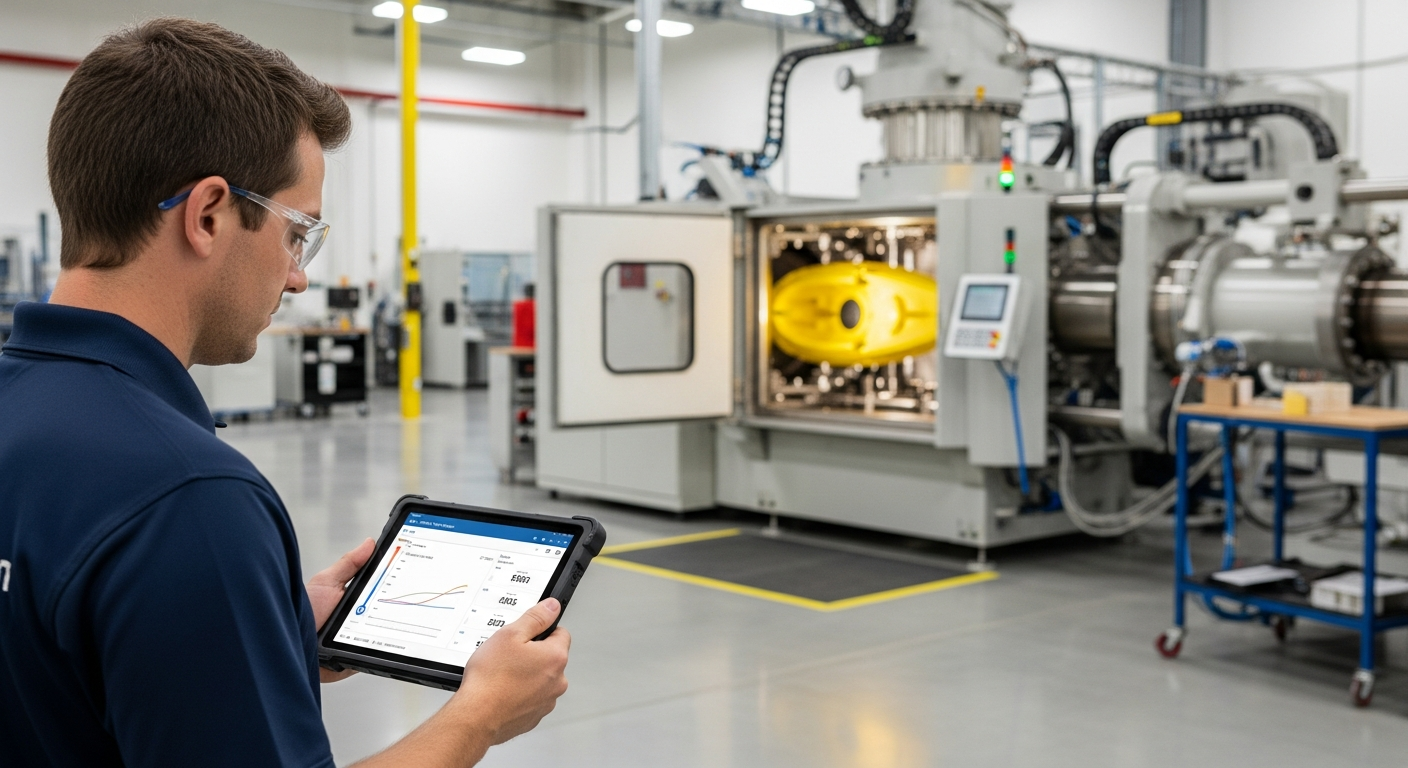
The rotational molding sector within Consumer Goods manufacturing is undergoing a quiet but significant shift. For decades, the unique physics of roto molding—relying on heat transfer and bi-axial rotation rather than high pressure—made it difficult to digitize. Cycle times are long, variables are complex, and legacy equipment is prevalent. However, recent performance data indicates that a new approach to operational visibility is helping plant leaders uncover hidden capacity without capital-intensive overhauls.
This analysis explores the current state of roto molding efficiency, based on insights from Guidewheel’s sensors over the last few months, between September and November 2025. The dataset covers specific Consumer Goods manufacturing environments, including over 1.1 million machine-minutes.
Rather than offering universal mandates, this report presents these findings as reference points. Every facility faces unique constraints regarding materials, mold complexity, and cooling requirements. The goal is to provide a framework for Plant Managers and Operations Directors to benchmark their own performance and identify pragmatic opportunities for improvement.
Operational Reality vs. Market Demand
It is important to contextualize these runtime figures. The data reveals that the single largest driver of lost time for these machines is "No Business/Orders," accounting for approximately 65% of total non-running time (Source: Guidewheel Performance Analysis).
This statistic highlights a crucial operational reality: capacity often exceeds current demand. Therefore, the strategic priority for Operations Directors is not necessarily "running more," but "running better." The goal is to maximize efficiency during the scheduled run blocks to reduce energy consumption per unit and free up labor for other value-added tasks, rather than simply filling capacity.
How Roto Molding Machine Monitoring is Transforming Consumer Goods Production Efficiency in 2026
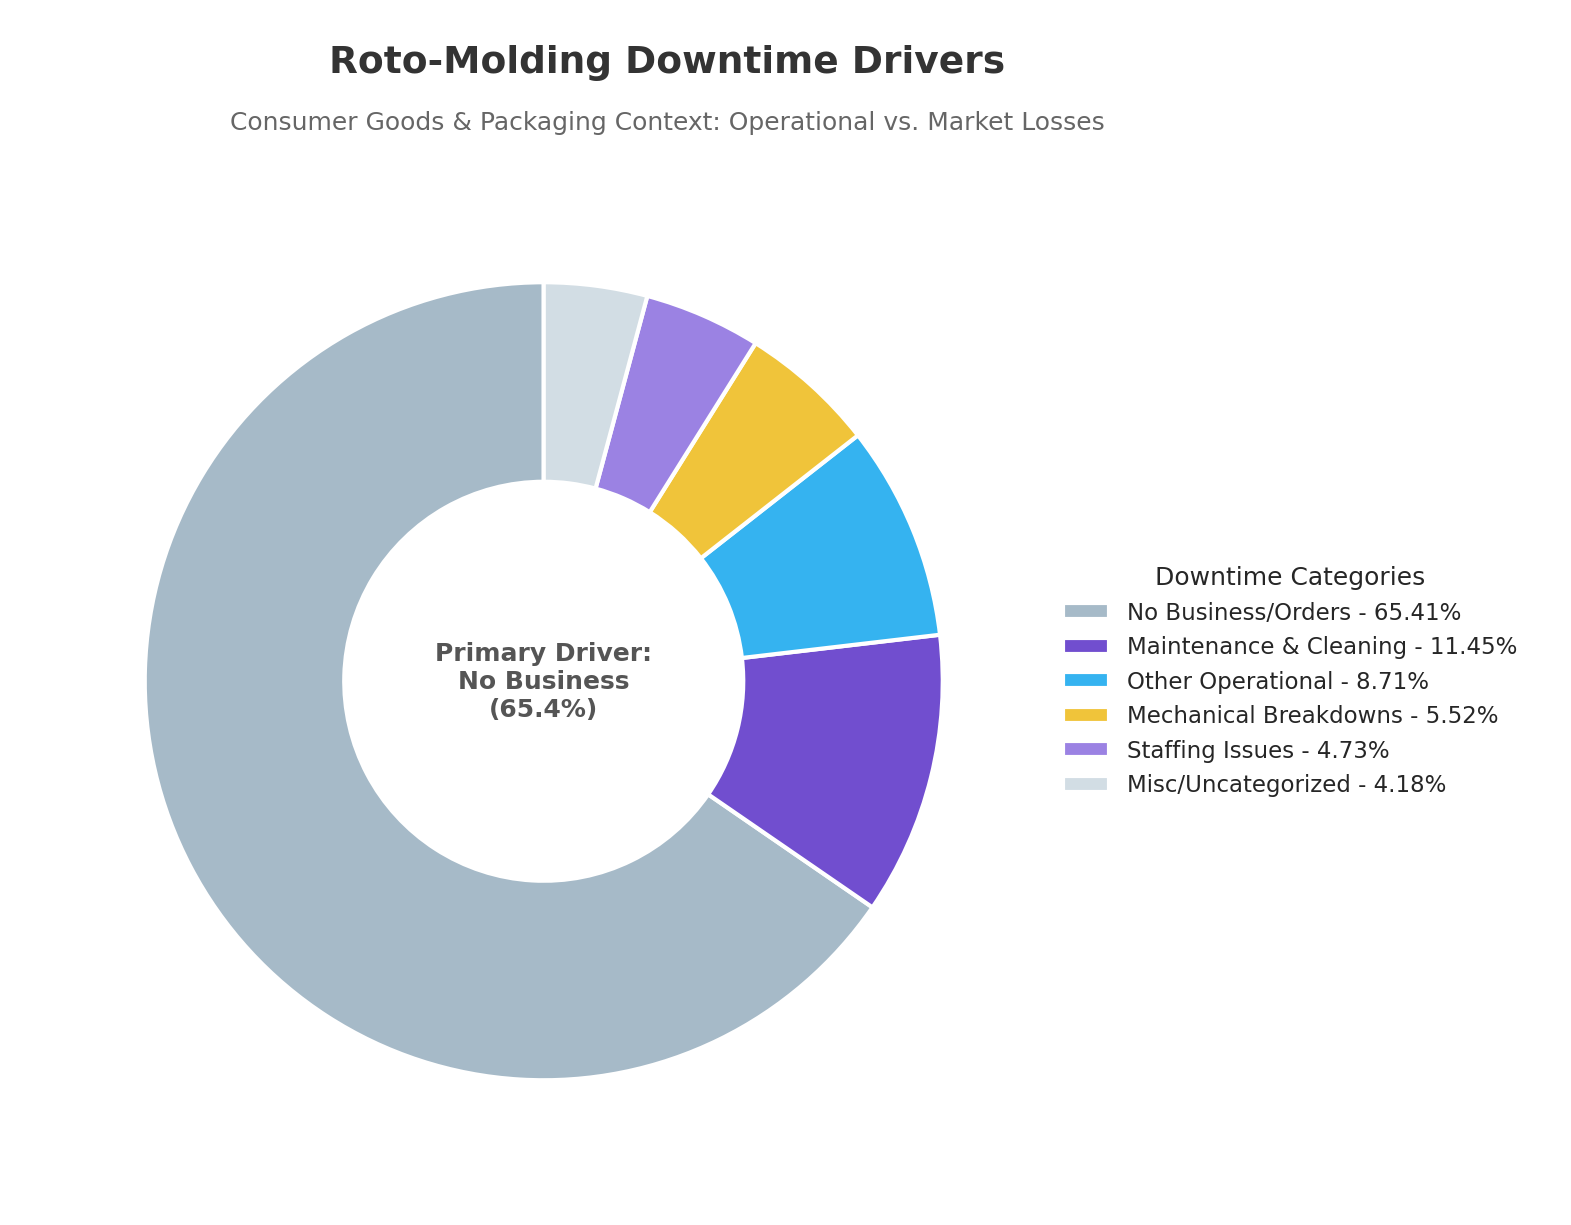
Figure 1: Distribution of downtime drivers in Consumer Goods Roto-Molding operations. While market demand dictates the largest share of downtime, significant operational capacity is lost to maintenance and operational factors. (Source: Guidewheel Performance Analysis, n=over 1.1 million machine-minutes)
The "Hidden" Downtime Drivers: Where to Focus
While market demand (No Business/Orders) is the statistical leader in lost time, it is largely outside the control of the plant floor. To drive operational efficiency, leaders must focus on the controllable losses. The data identifies three specific areas where pragmatic intervention can yield immediate results.
1. Maintenance and Cleaning (11.5% of Losses)
The second-largest category of downtime—and the largest controllable factor—is Maintenance & Cleaning, accounting for roughly 11.5% of all lost time (Source: Guidewheel Performance Analysis).
The Challenge: The average duration of a maintenance or cleaning event in this dataset is approximately 209 minutes (Source: Guidewheel Performance Analysis), referring primarily to major mold maintenance and changeovers. In roto molding, where process steps like mold release application and material changeovers are frequent, and maintenance downtime such as vent cleaning occurs periodically, these durations impact continuous flow.
The Opportunity: While some maintenance is unavoidable, the variability in these durations suggests that "planned" maintenance often drifts into "unplanned" extensions. Reducing this block by even 10% through better preparation or predictive alerts can save hundreds of production hours annually.
2. Other Operational Stops (8.7% of Losses)
"Other Operational" issues account for 8.7% of downtime, with an average duration of 118 minutes per event (Source: Guidewheel Performance Analysis).
The Challenge: This category typically includes start-ups, changeovers, meal breaks, and shift transitions. In roto molding, the thermal inertia of the ovens means that a "short" break can easily extend into a long operational delay as temperatures stabilize.
The Opportunity: This reflects variability in process timing. Real-time visibility into exactly when a machine goes idle allows managers to tighten shift handovers and ensure ovens aren't sitting idle longer than necessary during breaks.
3. Mechanical Breakdowns and Staffing
While less frequent, Mechanical Breakdowns account for 5.5% of downtime, and Staffing Issues account for 4.7% (Source: Guidewheel Performance Analysis).
The Challenge: Mechanical failures average 62 minutes to resolve, while staffing gaps can leave a machine down for over 200 minutes on average (Source: Guidewheel Performance Analysis).
The Opportunity: The data indicates that while mechanical failures are shorter, they are disruptive. Staffing issues, however, result in massive blocks of lost productivity. Remote monitoring allows skeleton crews to supervise multiple lines more effectively, mitigating the impact of labor shortages.
Transforming Operations with Real-Time Monitoring
The performance gaps identified in the data—specifically the 18% difference between median and top-quartile runtime—are rarely due to a lack of effort by the operators. Instead, they stem from a lack of visibility. In a loud, hot roto molding facility, it is difficult to manually track exactly when a cycle extended by 5 minutes or why a changeover took 3 hours instead of 2.
This is where modern machine monitoring transforms the equation. By moving from manual logs to automated, real-time data, Consumer Goods manufacturers can address the specific downtime drivers revealed in the analysis.
Bridging the Visibility Gap
Guidewheel and similar modern monitoring solutions address the unique challenges of roto molding by bypassing complex integration. Rather than requiring expensive PLCs or IT overhauls, these systems use non-intrusive, clip-on sensors to measure the electrical current—the "heartbeat"—of the machine.
This approach is particularly valuable for roto molding because the electrical draw of the motors and fans tells the story of the cycle:
Arm Rotation: Indicates the active cycle.
Oven/Fan Load: Can indicate heating vs. cooling phases.
Idle Draw: Differentiates between a stopped machine and one that is merely waiting.
From Reactive to Proactive Operations
The data shows that Maintenance & Cleaning and Operational Stops are the primary controllable losses. Real-time monitoring directly impacts these areas:
Shortening Maintenance Windows: By tracking the exact duration of maintenance stops, teams can benchmark their performance. If a mold change usually takes 90 minutes but took 209 minutes today, the system flags the anomaly, prompting a root cause discussion.
Tightening Operational Discipline: When operators have a real-time scoreboard showing whether they are winning or losing the shift, "micro-stops" during breaks or start-ups naturally decrease. The visibility creates a self-correcting feedback loop.
Predicting the Unplanned: For the 5.5% of downtime caused by mechanical breakdowns (Source: Guidewheel Performance Analysis), analyzing the machine's electrical signature can often reveal degrading motors or electrical heating elements (where applicable) before they fail, allowing teams to schedule repairs during non-production hours.
Empowering the FactoryOps Team
The most successful deployments of this technology do not use data to police the staff. Instead, they embrace a "FactoryOps" philosophy, putting data in the hands of the people closest to the work. When an operator can see that their heating cycle is drifting or that a cooling fan is drawing abnormal current, they can intervene immediately. This empowerment is critical for addressing the 4.7% of downtime attributed to staffing issues (Source: Guidewheel Performance Analysis)—when the team is stretched thin, technology acts as the force multiplier they need.
Moving Forward: Implementation Strategy
For Consumer Goods manufacturers looking to close the gap between their current performance and the top-tier benchmarks, the path forward involves three pragmatic steps:
Establish Your Baseline: You cannot improve what you do not measure. Use the industry median of 82.2% runtime (Source: Guidewheel Performance Analysis) as a reference point, but establish your own baseline using automated data, not manual logs.
Attack the "Big Bars": The data indicates that Maintenance/Cleaning and Other Operational stops are likely your biggest controllable losses. Focus your initial efforts there. specific goals to reduce average maintenance event duration from the industry average of ~200 minutes down to ~150 minutes.
Start Small, Scale Fast: Do not attempt to overhaul the entire factory at once. Clip sensors onto your critical bottleneck machines first—likely your largest roto molders—to prove the value and gain operator buy-in before scaling across the facility.
Start Optimizing Your Operations
The data is clear: while market conditions fluctuate, the efficiency of your roto molding lines remains under your control. The difference between an average operation and a world-class facility often lies in the ability to see, understand, and act on machine data in real-time. By leveraging simple, powerful monitoring tools, you can empower your team to eliminate wasted time and unlock hidden capacity.
“I’m liking the improvements that I’m seeing out of that team. 2-3 weeks ago, we were at 40-50% [runtime] and now the last couple of times I’ve looked at this were 60s and a couple of times I’ve seen it we’re in the 70s.”
Jeff McNabb, Supply Chain Manager, Myers Industries via Guidewheel's Customer Research
Ready to see what your machines are really doing? Book a demo with Guidewheel today to start your efficiency journey.
About the Author
Lauren Dunford is the CEO and Co-Founder of Guidewheel, a FactoryOps platform that empowers factories to reach a sustainable peak of performance. A graduate of Stanford, she is a JOURNEY Fellow and World Economic Forum Tech Pioneer. Watch her TED Talk—the future isn’t just coded, it’s built.

