No items found.
blog
The real ROI of real-time downtime tracking: numbers from the factory floor
By: Guidewheel
Updated:
March 16, 2026
9 min read

If you run a plant with more than a handful of production lines, you already know the feeling: your spreadsheet says one thing, your maintenance team says another, and nobody trusts the OEE number on the whiteboard. The gap between what you think your machines are doing and what they're actually doing is where margin quietly disappears.
This article breaks down the real predictive maintenance ROI and OEE improvement ROI you can expect when you move from manual tracking to automated, machine-level data collection. Not theory. Not vendor math. Just practical frameworks, benchmark data, and worked examples you can take to your CFO this quarter.
Key terms to know before we dig in
If you're building a business case internally, everyone needs to speak the same language. Here are the essentials.
Term |
What it means |
Why it matters |
|---|---|---|
OEE (Overall Equipment Effectiveness) |
Availability × Performance × Quality |
The single best metric for machine-level productivity |
Availability |
Uptime ÷ Total Scheduled Time |
Isolates downtime losses from speed and scrap losses |
MTBF (Mean Time Between Failure) |
Operating Hours ÷ Number of Failures |
Tracks whether your assets are getting healthier over time |
MTTR (Mean Time To Repair) |
Total Repair Hours ÷ Number of Failures |
Measures how fast your team recovers from breakdowns |
Payback Period |
Investment Cost ÷ Monthly Savings |
How many months until the project pays for itself |
ROI |
(Gain − Investment) ÷ Investment × 100 |
Percentage return, useful for comparing projects head-to-head |
The difference between ROI and payback period trips up a lot of teams. Payback answers "when do I break even?" while ROI answers "how much do I gain over time?" For most monitoring investments, payback matters more at the approval stage, and ROI matters more at renewal. Use both.
The problem: most plants are flying blind on downtime cost
Here's the uncomfortable math. A typical mid-sized manufacturer running five lines at 8% unplanned downtime with a weighted gross margin of $800 per line-hour is leaving roughly $640,000 on the table every year, just in lost throughput. That doesn't include reactive maintenance labor, expedited freight, or late-delivery penalties.
This usually isn't a people problem. It's a data problem. Manual downtime logging, the kind done with clipboards or end-of-shift Excel entries, captures only 40–60% of actual events (Source: Gartner MES Research). Small stoppages get rounded down or skipped. Root causes get lumped into catch-all buckets. By the time the data reaches your Monday morning production meeting, it's stale and incomplete.
The result? You can't prioritize. You can't prove which line needs attention first. And you can't build a credible predictive maintenance business case if your baseline numbers are guesses.
How simple current sensing changes the equation
The fastest path to trustworthy machine data collection isn't a massive MES overhaul or a PLC integration project. It's a simple clip-on current sensor.
Here's how it works in practice:
A split-core current transformer clamps around the power cable of any machine, no wire cutting, no PLC modification, no production disruption
The sensor reads the electrical draw, essentially the machine's "heartbeat," and transmits data through a small gateway via cellular or WiFi
Proprietary algorithms translate that current signature into run, idle, and down states, plus anomaly detection for condition monitoring
Operators see live status on a dashboard; maintenance gets proactive alerts when patterns shift
✅
Clip-on current sensors work on everything from brand-new servo-driven packaging lines to decades-old hydraulic presses, requiring no wire cutting, no PLC modification, and no IT infrastructure changes. Most plants go live in an afternoon rather than a fiscal quarter, making this the lowest-risk entry point for automated machine data collection. For plants with mixed fleets of legacy and modern equipment, this approach eliminates the typical integration barriers that stall digital transformation projects.
This approach works on everything from a brand-new servo-driven packaging line to a decades-old hydraulic press. Platforms like Guidewheel use this clip-on method to get machines connected in hours, not months, across mixed fleets of legacy and modern equipment. No IT infrastructure changes required.
For plants asking "what's the simplest way to start collecting machine data without disrupting production?", this is it. You're live in an afternoon, not a fiscal quarter.
What the benchmarks actually look like across industries
Once you have trusted data, the next question is: "How do we compare?" The answer depends heavily on your sector, your equipment mix, and how you measure.
Recent performance analysis across 3,000+ tracked machines reveals a critical nuance that most benchmark reports miss: aggregate runtime numbers can be deeply misleading without volume context (Source: Guidewheel Performance Analysis).
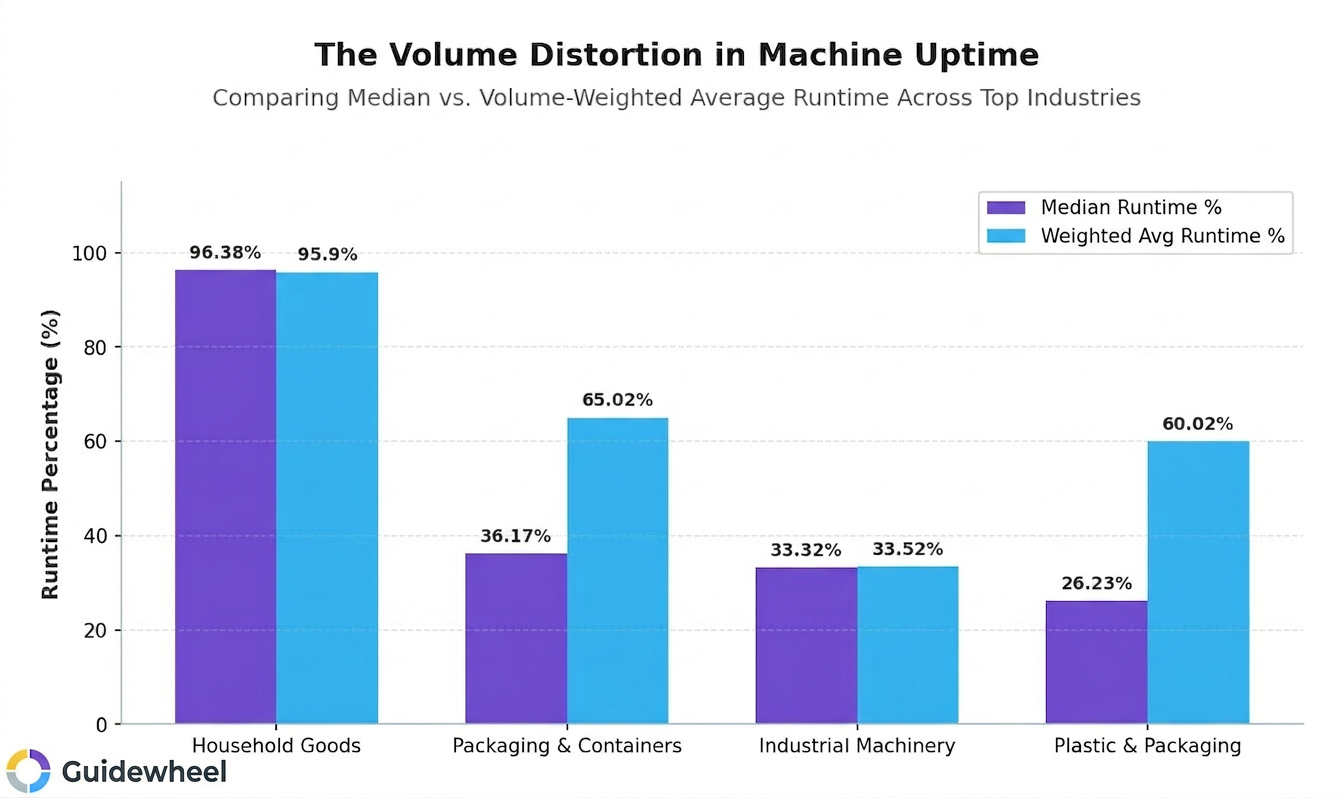
The chart above shows the gap between median runtime and volume-weighted average runtime across several manufacturing sectors. In plastics and packaging, for example, the median machine runs at roughly 26%, but high-volume machines in the same facilities average around 60%. That's a 34-percentage-point spread hiding inside a single "industry average."
What does this mean for your business case? If you're benchmarking your plant against a single OEE number, you might be dramatically over- or under-estimating your improvement potential. The table below provides reference points by sector, but remember: optimal performance varies by your specific facility context, product mix, and equipment age.
Sector |
Typical OEE range |
Target OEE |
Typical unplanned downtime |
|---|---|---|---|
Automotive (Discrete) |
70–75% |
85%+ |
4–6% |
Food & Beverage |
65–70% |
78–82% |
7–10% |
Plastics (Injection/Extrusion) |
60–70% |
75–80% |
8–12% |
Metal Fabrication |
55–65% |
70–75% |
5–7% |
Building Products |
60–72% |
75–85% |
7–9% |
These benchmarks serve as reference points. A plant running high-mix, low-volume jobs on aging equipment will look different from a dedicated high-speed line, and that's expected.
Where the hours actually disappear: downtime categories that matter
Knowing your OEE gap exists is one thing. Knowing where to intervene is where ROI gets real. The data across 3,100+ downtime events paints a clear picture of which loss categories deserve your attention first.
While "No Business/Orders" may dominate statistically at roughly 26% of total downtime, those events reflect demand constraints, not operational failures. The real opportunity is in the categories your team can directly control:
Downtime category |
% of total downtime |
Avg. duration per event |
Why it's actionable |
|---|---|---|---|
Other Operational |
28% |
81 min |
Process optimization, standardization across shifts |
Mechanical Breakdowns |
20% |
72 min |
Prime target for condition monitoring and predictive maintenance |
Electrical & Controls |
18% |
107 min |
Current sensing catches drift and anomalies early |
Material & Supply |
17% |
119 min |
Scheduling visibility reduces staging bottlenecks |
Staffing Issues |
13% |
197 min |
Remote alerts and operator dashboards help redeploy resources faster |
Maintenance & Cleaning |
11% |
85 min |
Standardized procedures reduce variability |
Mechanical breakdowns alone average 91 lost hours per year per line. At $800/hour gross margin, that's over $72,000 per line, per year in recoverable capacity. And these are the failures that condition monitoring catches 7–10 days before they become catastrophic, bearing wear shows up as elevated vibration, servo drift appears as a power signature change, hydraulic degradation triggers pressure anomalies.
For maintenance managers trying to shift from reactive work to planned interventions, this is the data that makes the case. You're not asking for budget to "go digital." You're asking for budget to recover margin that's currently walking out the door.
A practical ROI framework you can use today
Here's a simple three-step manufacturing ROI calculator framework. Plug in your own numbers:
Step 1: calculate your current downtime cost
Annual Downtime Hours = Unplanned Downtime % × Annual Scheduled Hours
Downtime Cost = Annual Downtime Hours × Gross Margin Per Hour
Step 2: estimate realistic recovery
Industry data suggests automated monitoring recovers 30–50% of preventable downtime in the first 12 months (Source: AMT and IEEE RAMS benchmarks). Use 40% as a conservative starting point.
Recovered Hours = Downtime Hours × 40%
Recovered Margin = Recovered Hours × Gross Margin Per Hour
Step 3: calculate equipment payback period and ROI
Payback (months) = Total Year 1 Investment ÷ (Annual Recovered Margin ÷ 12)
Year 1 ROI = (Recovered Margin − Investment) ÷ Investment × 100
Worked example for a 5-line plastics operation:
Input |
Value |
|---|---|
Annual scheduled hours (all lines) |
40,000 |
Unplanned downtime |
10% |
Gross margin per hour |
$900 |
Current downtime cost |
$3,600,000 |
Conservative recovery (40%) |
$1,440,000 |
Year 1 investment (hardware + software + training) |
$40,000 |
Payback period |
~0.3 months |
Year 1 ROI |
3,500% |
Even if your recovery rate is half that conservative estimate, payback still lands well under 6 months. That's the kind of math that helps teams move with confidence.
For continuous improvement leaders estimating payback for sensors across 100 machines, the hardware cost scales linearly (roughly $2,000–$4,000 per machine), but the margin recovery compounds, because cross-machine data reveals systemic patterns that single-machine monitoring misses.
Your 90-day implementation playbook
You don't need a multi-year roadmap. Here's how to prove value in weeks:
Phase |
Timeline |
Investment |
What you do |
Expected outcome |
|---|---|---|---|---|
Assess |
Weeks 1–2 |
Internal labor only |
Pull 3 months of downtime logs, rank by cost, identify top 3–5 loss categories |
Clear target list for pilot |
Pilot |
Weeks 3–8 |
$5K–$10K |
Clip-on sensors on 1–2 bottleneck machines, baseline data collection, set alerts |
20–40% downtime reduction on pilot assets |
Scale |
Weeks 9–16 |
$6K–$12K per machine |
Replicate to 3–5 more machines, consolidate dashboards, develop predictive triggers |
30–45% downtime reduction across group |
Optimize |
Months 4–12 |
SaaS subscription only |
Fleet-wide rollout, CMMS integration, quarterly benchmarking |
40–60% total downtime reduction, 70%+ planned maintenance |
The key insight: your first win, whether it's the spindle bearing swap or the servo alert, is what shifts your team's culture from "fix it when it breaks" to "prevent the failure before it happens."
Start recovering hidden capacity this quarter
The numbers from the factory floor tell a consistent story: real-time downtime tracking can pay for itself fast, often in weeks, not months. The ROI isn't theoretical. It comes from hours your machines are already losing, margin your lines are already leaking, and maintenance labor your team is already spending reactively.
The fastest path isn't a massive capital project. It's a low-risk pilot on your biggest bottleneck, proving value with your own data, then scaling what works.
We had our best month of the year, increasing production from 26k-35k/month to 46k cases in March. I attribute this to Guidewheel. Being able to see downtime data and address downtime reasons directly correlates to higher production.
Michael Palmer, Direct Pack.
If you're ready to see what your machines are actually doing, and turn that data into recovered margin, book a demo and start with one line. Prove value in weeks, then scale from there.
💡
Frequently asked questions
How do manufacturers calculate ROI for predictive maintenance?
The simplest approach: multiply the downtime hours you expect to avoid by your gross margin per hour, then subtract the monitoring investment. For a more complete picture, add maintenance labor savings, avoided emergency parts procurement, and reduced customer penalties. Most plants see 200–500% Year 1 ROI even using conservative recovery estimates, because the investment cost is low relative to the margin at stake.
What is a good OEE benchmark for my industry?
It depends on your sector, equipment age, and product mix. As general reference points, automotive operations often target 85%+, food and beverage packaging aims for 78–82%, and plastics facilities target 75–80%. Plants currently operating in the 50–65% range typically have the most improvement potential, especially those with older equipment, high changeover frequency, or reactive maintenance cultures. These targets should be adapted to your specific operational context.
What is the difference between ROI and payback period for manufacturing investments?
Payback period tells you how many months until your investment breaks even; it's the metric that gets projects approved. ROI tells you the total percentage return over time; it's the metric that justifies expansion and renewal. For downtime tracking projects, typical payback runs 1–4 months, while Year 1 ROI commonly reaches 500–1,500%. Use payback for the initial approval conversation, then ROI for the quarterly business review.
How can condition monitoring reduce unplanned downtime in a measurable way?
Condition monitoring sensors detect early warning signals, vibration increases from bearing wear, temperature rise from electrical drift, power signature changes from hydraulic degradation, typically 7–10 days before a catastrophic failure. This lead time lets your maintenance team schedule repairs during planned stops rather than scrambling during production. Plants with strong condition monitoring programs typically shift from 80% reactive / 20% planned maintenance to 70% planned / 30% reactive within 12 months.
What data is required to collect OEE accurately at the machine level?
At minimum, you need three data streams: run/stop status (for availability), cycle counts or output rate (for performance), and good vs. rejected units (for quality). The fastest way to capture the first two is through a clip-on current sensor that reads the machine's electrical draw, which works on any equipment regardless of age or brand. Quality data often starts as a manual input at the operator level and becomes automated as the system matures. Even partial OEE data, availability alone, delivers immediate value for downtime prioritization.
About the author
Lauren Dunford is the CEO and Co-Founder of Guidewheel, a FactoryOps platform that empowers factories to reach a sustainable peak of performance. A graduate of Stanford, she is a JOURNEY Fellow and World Economic Forum Tech Pioneer. Watch her TED Talk—the future isn't just coded, it's built.

