No items found.
blog
How a Machine Monitoring System Reduces Downtime in Steel & Metals Grinding and Polishing Operations
By: Guidewheel
Updated:
December 19, 2025
10 min read
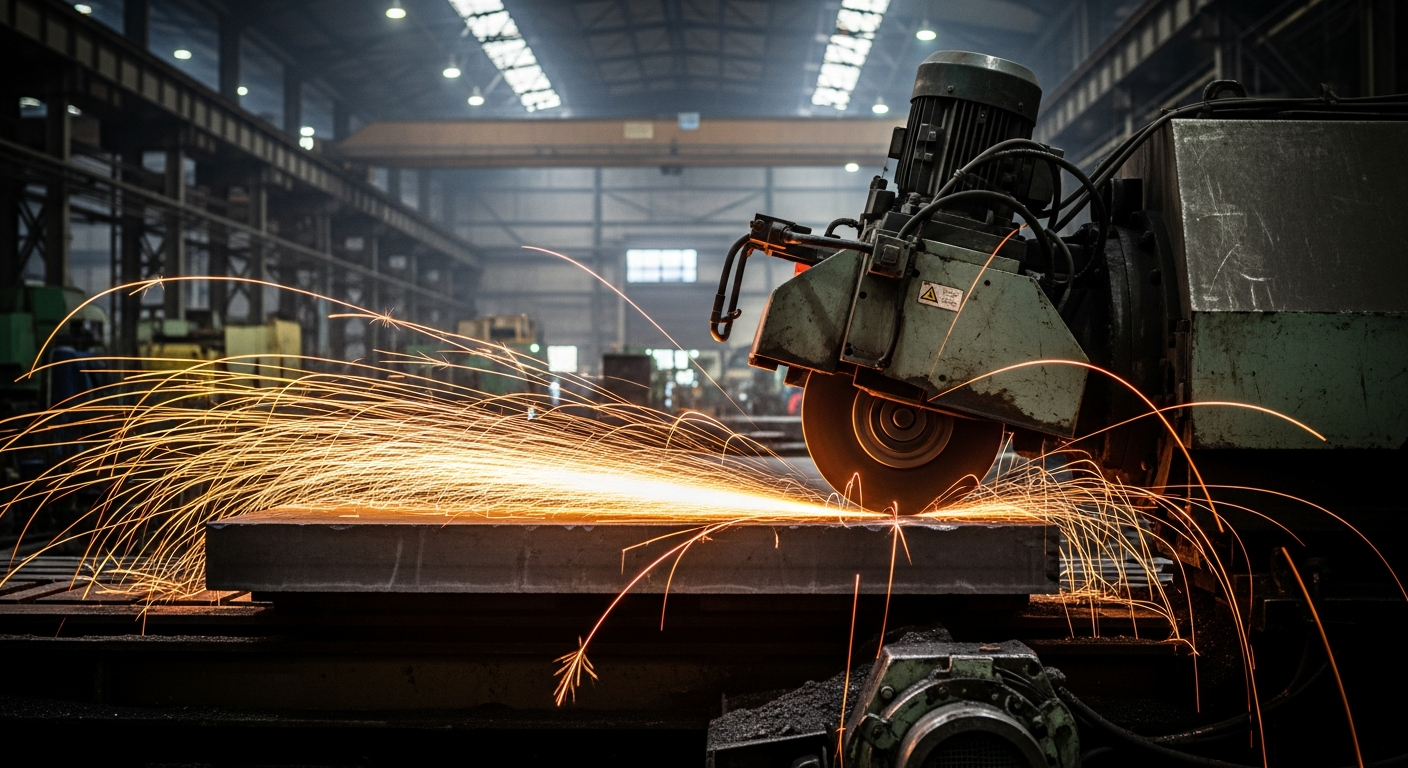
The pressure to increase throughput while maintaining strict quality standards is a constant reality for plant managers and operations directors in the Steel & Metals industry. In grinding and polishing operations—where precision surface finishing meets heavy industrial processing—unplanned downtime is a significant factor impacting profitability and capacity.
While many facilities rely on manual logs or "gut feel" to estimate machine utilization, the difference between perceived uptime and actual runtime often reveals a significant "hidden factory." A machine monitoring system eliminates this ambiguity, transforming raw amperage and electrical data into actionable insights that empower teams to reduce downtime and hit production targets.
This analysis explores the current state of grinding and polishing machine performance, utilizing comprehensive sensor data to establish industry benchmarks and identify the specific operational levers that drive efficiency in 2026.
Performance Benchmarks for Grinding and Polishing Machines
Understanding where your equipment stands relative to industry peers is the first step toward optimization. Recent analysis reveals that grinding machines—often critical bottlenecks in finishing departments—show distinct performance patterns compared to other metalworking assets.
Runtime Performance Overview
Based on Guidewheel Performance Analysis, Grinding machines in the industrial sector operate with a median runtime of 22.4%. While this figure might initially seem low to those accustomed to estimating utilization based on shift hours, it is actually slightly higher than the broader sector median of 20.6%.
When analyzing the top quartile of performers—those facilities that have likely optimized their feed systems and changeover processes—runtime for similar equipment types climbs significantly higher. However, looking at the median provides a realistic baseline for typical job-shop and high-mix production environments common in Steel & Metals.
Comparative Asset Performance
To place grinding machine performance in context, it is helpful to look at how they perform relative to other assets on the production floor. The data indicates that grinders generally maintain higher active utilization than complex CNCs but trail behind continuous auxiliary equipment.
Chillers: 95.1% Median Runtime (Auxiliary equipment typically runs continuously).
Grinders: 22.4% Median Runtime (Process-driven, often batch-dependent).
Presses: 20.1% Median Runtime (Subject to setup and load/unload cycles).
CNCs: 18.5% Median Runtime (High setup complexity often reduces green-light time).
(Source: Guidewheel Performance Analysis)
This hierarchy suggests that while grinders are not the lowest performers in the fleet, there is substantial "hidden capacity" available. Even a modest increase from 22% to 30% runtime represents a massive gain in throughput without purchasing new equipment.
How a Machine Monitoring System Eliminates Downtime in Steel & Metals Grinding and Polishing Operations in 2026
(Source: Guidewheel Performance Analysis, n=4.0 million machine-minutes)
Cross-Industry Context
It is also valuable to note how grinding operations differ by sector. In the Plastics industry, for example, grinding machines (often used for granulating scrap) achieve a median runtime of nearly 59% (Source: Guidewheel Performance Analysis). This stark contrast highlights the difference between the continuous, automated nature of plastics recycling versus the often manual, high-precision finishing work required in Steel & Metals. For metal operations, bridging this gap requires focusing on the specific downtime drivers that interrupt the finishing cycle.
Analyzing the Top Causes of Downtime
To eliminate downtime, one must first categorize it accurately. The performance analysis identifies the specific reasons grinding and polishing lines stop. While some factors are market-driven, the secondary drivers represent the most immediate opportunities for operational improvement.
1. No Business / Orders (49%)
Nearly half of all recorded downtime falls under "No Business" or "No Orders." This indicates that for many manufacturers, the machine is available, but the production schedule does not demand it.
Operational Context: While often viewed as a sales issue, this metric is vital for operations directors. It signals potential over-capacity or the need for better production smoothing.
Duration: These events are long, averaging nearly 4 hours (233 minutes).
Strategy: Accurate monitoring confirms true capacity, allowing sales teams to quote shorter lead times with confidence, potentially filling these gaps.
2. Staffing Issues (20%)
Staffing availability accounts for nearly one-fifth of all lost time. This does not necessarily imply a labor shortage, but rather a misalignment between operator availability and machine scheduling.
Duration: Averaging 143 minutes per event.
Operational Context: This often occurs when operators are pulled to other tasks, in meetings, or on breaks while the machine sits idle. In grinding operations, where manual loading/unloading is common, the machine cannot run without the operator.
Strategy: Real-time visibility allows managers to see when machines are idle due to staffing and adjust shift schedules or "floater" positions to keep critical bottlenecks running.
3. Other Operational Stops (8%)
These represents cumulative frequent interruptions—micro-stops, feeding issues, and minor adjustments that don't qualify as full breakdowns.
Duration: Averaging 47 minutes.
Operational Context: In polishing lines, this might be a jammed part, a belt adjustment, or a quick abrasive change.
Strategy: Because these happen frequently (0.1 events per shift), identifying chronic micro-stops is often the fastest way to reclaim 5-10% capacity.
4. Maintenance & Cleaning (8%)
Planned maintenance is essential, but it consumes significant capacity.
Duration: Averaging 70 minutes.
Operational Context: Grinding generates swarf and dust, necessitating frequent cleaning. However, if cleaning cycles are inefficient, they eat into production.
Strategy: Monitoring helps transition from "schedule-based" cleaning to "usage-based" maintenance, ensuring downtime is taken only when necessary.
5. Mechanical Breakdowns (7%)
True unplanned mechanical failure accounts for roughly 7% of downtime.
Duration: Averaging 35 minutes.
Operational Context: While less frequent than staffing issues, these are the most disruptive because they are unplanned. In grinders, this often involves spindle issues, belt breaks, or coolant pump failures.
Strategy: Tracking the frequency of these short-duration failures can help predictive maintenance teams intervene before a prolonged failure occurs.
(Source: Guidewheel Performance Analysis)
Implementing Real-Time Monitoring for Downtime Reduction
The data clearly indicates that while mechanical breakdowns are a factor, the majority of actionable downtime in Steel & Metals grinding stems from operational inefficiencies—staffing gaps, micro-stops, and maintenance scheduling. Addressing these requires a machine monitoring system that provides granular, real-time visibility into the "heartbeat" of the factory floor.
The Role of Non-Intrusive Monitoring
For many steel facilities, the equipment roster is a mix of brand-new CNC polishers and legacy grinding machines that have been reliable workhorses for decades. Traditional monitoring solutions often require complex IT integration or PLC upgrades, which can be cost-prohibitive for older assets.
Guidewheel addresses this specific challenge with a distinct approach designed for the reality of the factory floor:
Universal Compatibility: By using simple clip-on current sensors, the system can monitor any machine—from a 1980s centerless grinder to a modern robotic polishing cell—without touching the machine's internal warranty-voiding electronics.
Cellular & Internet Connectivity: Recognizing that Wi-Fi can be spotty in heavy industrial environments containing large metal structures, the system supports cellular connectivity, bypassing complex IT firewalls and getting data flowing immediately.
From Visibility to Action: The proprietary algorithms don't just record current; they interpret the machine's electrical "heartbeat" to distinguish between running, idling, and off states. This automatically categorizes downtime, allowing operators to tag reasons (e.g., "Wheel Change," "No Operator") via a tablet interface.
Addressing the Specific Downtime Drivers
Integrating this level of visibility directly targets the downtime categories identified in the performance analysis:
Solving Staffing Gaps: A "Plant Pulse" scoreboard visible on the floor allows supervisors to see instantly which machines are idling. If a critical grinder stops because an operator is missing, relief can be deployed immediately, reducing the average 143-minute duration of staffing-related downtime.
Reducing Maintenance & Cleaning Impact: Instead of scheduling cleaning every shift regardless of usage, maintenance teams can monitor actual runtime hours. If a machine only ran 20% of the shift, the 70-minute cleaning block might be deferred, keeping the machine available for production.
Preventing Mechanical Failures: By establishing a baseline of normal energy draw, the system can detect anomalies—such as the increased load from a dull grinding wheel or a failing spindle bearing—alerting maintenance teams to intervene before a 35-minute breakdown turns into a multi-day repair.
This "FactoryOps" approach centers on empowering the people closest to the work. It moves the culture from reactive "firefighting" to proactive management, where decisions are made based on live data rather than historical logs.
Transform Your Production Line
The difference between an average operation and a market leader often lies in the visibility of their data. By lifting the veil on the "hidden factory," operations leaders can recover lost capacity, justify investments, and empower their teams to win the day.
Start Optimizing Your Operations
With the updated Scoreboard, our supervisors quickly got up to speed. We review it together, and it’s already helping day-to-day.
Michael Sanchez, Industrial Metal Supply.
Ready to unlock hidden capacity in your grinding and polishing operations?
About the Author
Lauren Dunford is the CEO and Co-Founder of Guidewheel, a FactoryOps platform that empowers factories to reach a sustainable peak of performance. A graduate of Stanford, she is a JOURNEY Fellow and World Economic Forum Tech Pioneer. Watch her TED Talk—the future isn’t just coded, it’s built.

