No items found.
blog
Industry Report: Slitter Monitoring in Plastics & Packaging Plants 2026
By: Guidewheel
Updated:
December 19, 2025
8 min read
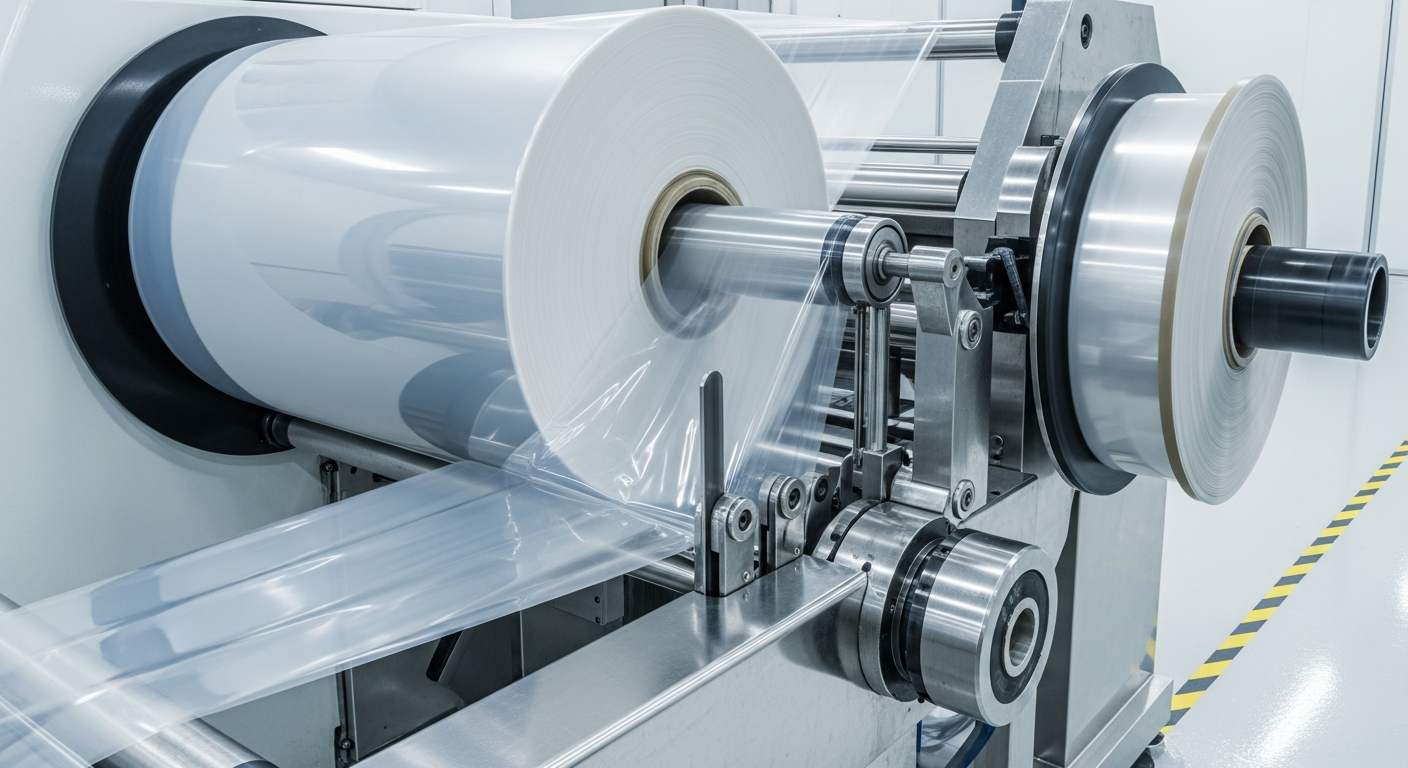
For plant managers and operations directors in the plastics and packaging sector, the slitter machine often represents a paradoxical asset. It is a critical finishing step for converting raw film and flexible materials into finished roll products, yet it frequently operates as a "black box" regarding performance data. While high-speed extrusion lines often receive significant capital investment and monitoring, slitters are frequently legacy assets—mechanically sound but digitally disconnected.
In an environment where margin pressures are intensifying, the ability to unlock hidden capacity in these finishing assets is becoming a strategic differentiator. Rather than defaulting to expensive capital equipment upgrades, leading manufacturers are turning to operational visibility to reclaim lost productivity.
This report analyzes recent performance data to establish industry benchmarks, identify common downtime drivers, and outline how real-time monitoring strategies can transform slitter operations from a bottleneck into a competitive advantage.
Slitter Performance: Industry Benchmarks and Patterns
To understand where opportunities for optimization lie, it is essential to look at how slitters perform relative to other critical assets in the production chain. Recent performance data reveals that while slitters are often capable of rapid cycles, they are subject to significant variability.
While the 12-minute median for slitters suggests high efficiency potential, the spread in the data indicates that process standardization varies widely. Top-performing facilities achieve single-digit changeover times, while others struggle with extended setups due to manual blade positioning and tension adjustments.
Figure 1: Comparative median changeover times across key plastics and packaging assets. (Source: Guidewheel Performance Analysis, n=31.3 million machine-minutes)
Runtime and Utilization Trends
Runtime performance—the percentage of time the machine is actively producing—shows a stark contrast between average and top-tier operations.
- Top Quartile Performers: In broader industrial machinery contexts comparable to high-performing packaging environments, top-quartile assets achieve runtimes approaching 58%.
- Median Performance: In specific sub-sectors of packaging, observed median runtimes can be significantly lower, often ranging between 35% and 50%.
(Source: Guidewheel Performance Analysis)
This gap suggests that while the mechanical capability for high throughput exists, operational friction—ranging from material handling delays to micro-stops—frequently suppresses actual utilization.
Downtime Analysis: The Hidden Drivers of Efficiency Loss
While "No Business/Orders" often dominates statistical downtime categories in aggregate data, the most actionable opportunities for plant managers lie in the operational downtime drivers. These are the factors within the direct control of the plant floor team.
Based on the dataset, the following categories represent the primary controllable losses in Plastics & Packaging operations.
-
Maintenance and Cleaning (11.5% of Downtime)
Maintenance and cleaning represent the largest controllable downtime category, accounting for 11.5% of total recorded downtime.
- Duration Impact: These events are notably long, averaging 209.0 minutes per event.
- Operational Context: The extended duration suggests that these are not quick operational wipes but likely deep cleaning cycles, blade sharpening intervals, or complex preventative maintenance routines.
- Optimization Opportunity: While maintenance is necessary, the sheer duration indicates potential inefficiencies in the maintenance workflow or a reliance on reactive interventions that turn into major repairs. Reducing this block by even 10% through better scheduling or condition-based monitoring can yield significant capacity gains.
(Source: Guidewheel Performance Analysis)
-
Other Operational Losses (8.7% of Downtime)
Categorized as "Other Operational," this segment accounts for 8.7% of downtime and includes miscellaneous interruptions that often fly under the radar.
- Duration Impact: Events average 118.1 minutes.
- Common Causes: Operator notes frequently cite "Start up," "Comida" (Meal breaks), and "Otros No planeados" (Unplanned others).
- Operational Context: This category often reflects process gaps—shift handovers that drag on, startup procedures that lack standardization, or breaks where the machine is left idle rather than staggered.
(Source: Guidewheel Performance Analysis)
-
Mechanical Breakdowns (5.5% of Downtime)
Mechanical failures account for 5.5% of downtime, a figure that might seem low but carries high disruption costs.
- Duration Impact: These events average 62.1 minutes.
- Common Causes: Notes often reference "Preform Tipping" or upstream/downstream equipment failure.
- Operational Context: This highlights the interconnected nature of the slitter. It is rarely an island; failures in upstream extrusion or downstream packing directly arrest the slitter. The unpredictable nature of these breakdowns disrupts production scheduling more severely than planned maintenance.
(Source: Guidewheel Performance Analysis)
-
Staffing Issues (4.7% of Downtime)
Staffing-related downtime accounts for 4.7% of losses.
- Duration Impact: These are long-duration events, averaging 201.9 minutes, suggesting half-shifts or full shifts running without adequate coverage.
- Operational Context: In an era of skilled labor shortages, this metric is critical. It reinforces the need for tools that make operators more efficient, allowing fewer staff to manage multiple lines effectively through remote monitoring and mobile alerts.
(Source: Guidewheel Performance Analysis)
Sector-Specific Variance: The Packaging Sub-Sector
It is worth noting that within specific high-volume packaging sub-sectors, the downtime profile shifts dramatically. In these environments, Other Operational issues can spike to 31.7% of downtime with shorter average durations (81 minutes), while Mechanical Breakdowns can rise to 29.1%. This variance underscores the importance of baselining your specific facility rather than relying solely on generic industry averages.
(Source: Guidewheel Performance Analysis)
From Data to Action: The Role of Monitoring Solutions
The data indicates that a significant portion of slitter capacity is lost not to catastrophic failure, but to accumulated inefficiencies: extended cleaning cycles, slow startups, and uncoordinated breaks. Addressing these requires a shift from reactive operations to a "system of action" where data drives decision-making.
The Visibility Gap in Legacy Equipment
Most slitter machines in operation today are robust, legacy assets. They cut and rewind effectively but lack the native connectivity to report why they stopped. This forces plant managers to rely on manual logs, which are often incomplete or inaccurate. As the data shows, categories like "Other Operational" often mask the true root causes of downtime.
To close this gap, modern monitoring solutions must meet specific criteria relevant to plastics and packaging:
- Universal Compatibility: Solutions must work across mixed fleets—from brand-new slitters to 30-year-old rewinders—without requiring complex PLC integration.
- Real-Time Granularity: Data must be captured second-by-second to identify micro-stops that aggregate into major losses.
- Operator-Centric Design: The system should empower operators with visibility, not just surveil them.
Guidewheel: A FactoryOps Approach to Slitter Monitoring
Guidewheel addresses the specific challenges identified in the performance analysis by providing a non-intrusive, scalable monitoring layer that works on any machine.
- Clip-On Sensor Technology: Guidewheel utilizes simple clip-on current sensors that can be installed in minutes without cutting wires or accessing the machine's PLC. This is particularly valuable for legacy slitter equipment where integration costs usually prohibit monitoring.
- Proprietary Algorithms: While the hardware is simple, the core value lies in the cloud-based algorithms. These proprietary models analyze the power draw to distinguish between running, idling, and downtime states with high precision, automatically categorizing the "micro-stops" that often go unreported.
- Flexible Connectivity: Recognizing that Wi-Fi can be spotty on factory floors, Guidewheel hubs can operate using cellular connections, though they also fully support facility internet/ethernet when available. This ensures continuous data transmission regardless of IT infrastructure limitations.
- FactoryOps Philosophy: The platform is designed to be a "system of action." Instead of just generating reports, it provides real-time alerts to operators and maintenance teams. For example, if a slitter remains in a "Cleaning" state longer than the benchmarked 209 minutes, an alert can trigger a check-in, helping reduce the average duration of these events.
By visualizing the 11.5% of time lost to maintenance and the 8.7% lost to operational gaps, Guidewheel converts hidden data into actionable opportunities for continuous improvement.
(Source: Guidewheel)
Unlocking Hidden Capacity
The path to improved slitter performance does not necessarily require new machinery. The data reveals that significant capacity is currently hidden within long changeovers, extended maintenance windows, and operational pauses. By establishing a reliable baseline of performance and targeting the specific downtime drivers identified in this report—specifically maintenance duration and operational readiness—plastics and packaging leaders can reclaim valuable production hours.
Achieving this requires moving beyond manual tracking to automated, real-time visibility. With the right data, plant managers can shift from reacting to daily crises to orchestrating a more efficient, predictable, and profitable operation.
Start Optimizing Your Operations
Transforming your slitter performance begins with visibility. By identifying and addressing the root causes of downtime, you can unlock hidden capacity and drive measurable ROI.
Ready to see how Guidewheel can work for your facility? Book a demo to learn more.
About the Author
Lauren Dunford is the CEO and Co-Founder of Guidewheel, a FactoryOps platform that empowers factories to reach a sustainable peak of performance. A graduate of Stanford, she is a JOURNEY Fellow and World Economic Forum Tech Pioneer. Watch her TED Talk—the future isn’t just coded, it’s built.

