No items found.
blog
How Condition Monitoring for Plastic Scrap Grinders Improves Uptime and Scrap Recovery (2026)
By: Guidewheel
Updated:
December 19, 2025
11 min read

In the high-volume world of Plastics & Packaging manufacturing, auxiliary equipment often operates in the shadow of primary injection molders and extruders. However, data indicates that the plastic scrap grinder—often viewed merely as a utility—is actually a critical production asset that significantly influences overall facility throughput and sustainability targets.
When a grinder fails, the closed-loop process is disrupted, forcing operators to manually handle scrap and potentially leading to material storage issues. For Plant Managers and Operations Directors, unlocking the hidden capacity in these machines is not just about maintenance; it is about securing the facility's operational resilience.
This article analyzes recent performance data to establish benchmarks for grinder operations, identifies the root causes of efficiency loss, and explores how predictive maintenance strategies can bridge the gap between average performance and industry leaders.
The Scope of the Data Analysis
The insights presented in this report are derived from a comprehensive analysis of machine performance based on Guidewheel's sensors over the last few months, between September and November 2025. The dataset captures real-time operational signatures from specific manufacturing areas within the Plastics & Packaging sector.
To ensure transparency regarding the scope of these insights, the analysis references a dataset covering over 0.4 million machine-minutes across grinders in plastics and industrial machinery environments. While this data represents specific operational contexts within the industry rather than universal truths, it provides a high-fidelity window into the actual operational behaviors of grinding equipment.
Grinder Performance Benchmarks in Plastics & Packaging
Understanding what constitutes "good" performance is the first step toward optimization. The recent performance data reveals a distinct operational profile for grinders within the Plastics & Packaging sector compared to other industries.
The data indicates that grinders in this sector are not merely support tools but are utilized as production-critical assets.
Utilization and Runtime Analysis
According to the analysis, grinders in the Plastics & Packaging industry demonstrate a median runtime of 59%. This figure serves as a solid baseline for evaluating facility performance. However, the data reveals a significant spread in performance capabilities:
- Top Quartile Performers: The most efficient machines in the dataset achieve a runtime of 97%. This suggests that in optimized environments, these machines are capable of near-continuous operation, effectively matching the pace of primary production lines.
- The Performance Gap: The difference between the median (59%) and top performers (97%) represents a substantial opportunity for capacity recovery. For many facilities, this gap implies that existing equipment could potentially handle significantly higher scrap volumes without capital investment in new machinery.
How Predictive Maintenance for Plastic Scrap Grinders Boosts OEE and Scrap Recovery in Plastics & Packaging (2026)
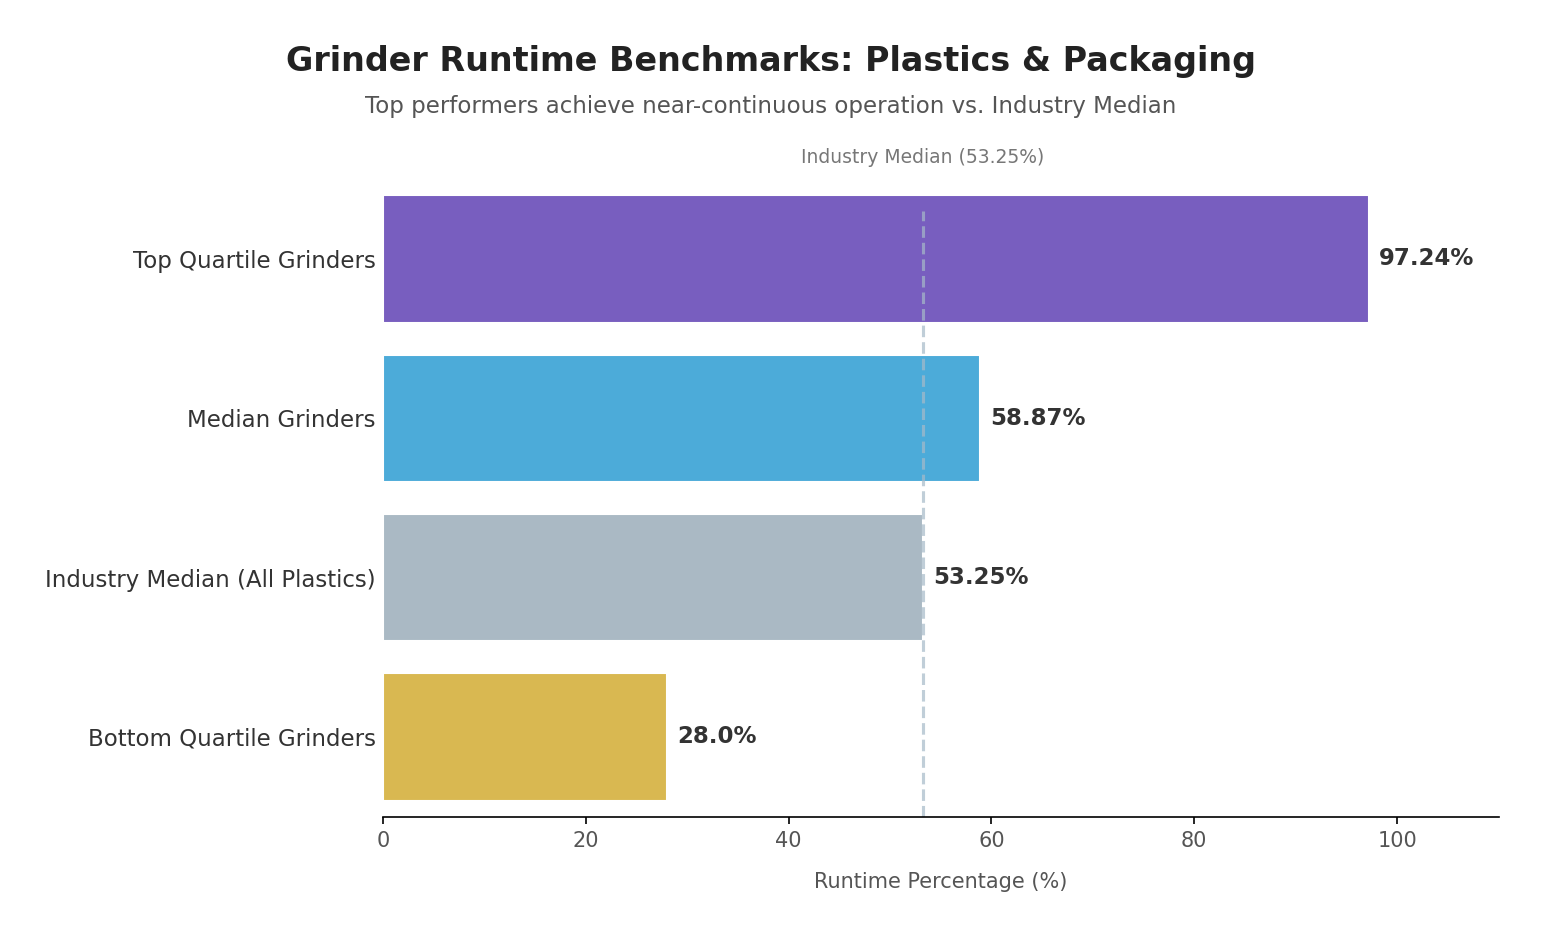
Figure 1: This visualization highlights the significant operational gap between average machines and top performers, which run nearly continuously. (Source: Guidewheel Performance Analysis, n=over 0.4 million machine-minutes)
Cross-Industry Context
To validate the importance of grinders in Plastics & Packaging, it is useful to compare their usage against other sectors.
- Plastics & Packaging: Median Runtime 59%.
- Industrial Machinery: Median Runtime 22%.
(Source: Guidewheel Performance Analysis)
In the Industrial Machinery sector, grinders often operate intermittently, likely supporting manual fabrication tasks. In contrast, the significantly higher utilization in Plastics confirms that these machines are integral to the core production flow. Consequently, a downtime event in a plastics plant has a far more immediate and costly impact on throughput than in general manufacturing.
Analyzing the Root Causes of Grinder Downtime
While high-level benchmarks provide a target, improving OEE requires understanding exactly why machines stop. The dataset analyzes over 2,600 downtime events to categorize the specific loss drivers affecting grinder availability.
While "No Business/Orders" accounts for a large portion of recorded downtime (approximately 65%), this typically reflects demand fluctuations rather than equipment reliability. For maintenance managers and operations directors, the actionable insights lie in the remaining 35% of operational downtime—the losses that are directly controllable by the plant team.
1. Maintenance & Cleaning (11% of Total Downtime)
This category represents the second-largest loss driver and is characterized by long-duration events.
- Average Duration: Approximately 3.5 hours per event.
- Operational Impact: These extended stops often consume half a shift. This suggests that maintenance events are not quick adjustments but major interventions—likely involving blade changes, deep cleaning for material changeovers, or reactive repairs that require significant disassembly.
- Optimization Opportunity: The length of these events indicates a need for better planning. Moving from reactive maintenance to planned, predictive windows can help reduce the "wrench time" required per event.
2. Mechanical Breakdowns (5.5% of Total Downtime)
While mechanical breakdowns account for a smaller percentage of total time than maintenance, they are the most frequent operational interruption.
- Frequency: 0.12 events per shift (The highest frequency of all operational issues).
- Average Duration: Approximately 1 hour per event.
- The "Death by a Thousand Cuts": These relatively short but frequent stops—likely caused by jams, belt slippage, or minor component failures—are particularly damaging to OEE. They disrupt the rhythm of production, require operator intervention, and often go unreported in manual tracking logs because they are "fixed quickly." However, over a month, these hours accumulate significantly.
3. Staffing Issues (4.7% of Total Downtime)
Staffing-related downtime is rare but severe when it occurs.
- Average Duration: Approximately 3.3 hours per event.
- Context: This likely reflects shifts or partial shifts where the grinder could not run due to operator unavailability. In an era of skilled labor shortages, this metric highlights the value of monitoring systems that allow fewer operators to oversee more equipment effectively.
4. Other Operational Issues (8.7% of Total Downtime)
This catch-all category includes start-up delays, pending quality control (QC) checks, and miscellaneous interruptions.
- Frequency: 0.1 events per shift.
- Average Duration: Approximately 2 hours.
- Context: These are often process-related inefficiencies rather than hard machine failures. For example, waiting for a QC check on regrind quality before restarting the machine falls into this bucket.
From Data to Action: The Case for Condition Monitoring
The data reveals a clear pattern: Plastics & Packaging facilities lose significant capacity to a combination of long maintenance events and frequent, short-duration mechanical failures. Traditional maintenance approaches often struggle to address these specific profiles.
The Limitations of Manual Tracking
Many facilities rely on manual logs to track downtime. However, manual data collection rarely captures the 60-minute mechanical breakdown or the intermittent 15-minute jam. Operators focused on clearing a jam often prioritize restarting the machine over logging the event.
As a result, management sees the "No Business" time but misses the frequency of mechanical interruptions that are eroding the machine's true performance (Performance and Availability in OEE).
Energy Efficiency and Sustainability
Beyond OEE, grinder performance is intrinsically linked to sustainability. Grinders are energy-intensive assets. A dull blade or a failing bearing doesn't just risk downtime; it causes the motor to draw significantly more current to do the same amount of work.
Monitoring amperage draw (motor load) serves a dual purpose:
- Predictive Health: Increasing load trends often indicate blade dulling or screen blinding.
- Sustainability: Keeping the machine running at optimal efficiency reduces the energy cost per kilogram of recycled material, directly supporting corporate sustainability initiatives (Source: Load Controls).
Comprehensive Monitoring Solutions for Plastics Operations
To close the gap between median performance (59%) and top-tier capability (97%), plastics manufacturers are increasingly adopting digital manufacturing platforms. The goal is to move from reactive crisis management to proactive, data-driven operations.
The Need for Operational Visibility
The performance analysis highlights that "Maintenance & Cleaning" and "Mechanical Breakdowns" are distinct challenges requiring different solutions. A robust monitoring strategy must provide visibility into both:
- Long-term trends to optimize maintenance intervals.
- Real-time alerts to catch frequent mechanical slips immediately.
Guidewheel: A FactoryOps Approach
Guidewheel offers a solution specifically designed to address these challenges without the complexity of traditional heavy industrial integrations. The platform focuses on empowering operational teams with accessible, actionable data.
- Universal Compatibility via Clip-On Sensors Guidewheel utilizes non-invasive, clip-on sensors that measure the electrical current drawing into the machine. This is particularly valuable for grinders, which may range from brand-new units to legacy equipment that lacks modern PLC data ports. The sensors can be installed in minutes without cutting wires or voiding warranties.
- Proprietary Algorithms and Analysis While the sensors gather the raw data, the core value lies in how that data is processed. Guidewheel's proprietary algorithms analyze the electrical signature of the grinder to distinguish between:
- Idle: Machine on but not grinding.
- Running: Machine actively processing material.
- Off/Down: Machine stopped.
- Flexible Connectivity Recognizing that many plastics facilities have varying IT infrastructures, the system is designed to operate via cellular connections, bypassing complex corporate firewalls and IT security reviews. However, it also supports standard internet connectivity where available, offering flexibility based on the facility's environment.
- Empowering the Workforce
The "FactoryOps" philosophy centers on the operator. By providing real-time dashboards (Scoreboards) visible on the plant floor, operators can see their own performance metrics. This transparency often leads to immediate, self-directed improvements in utilization, addressing the "Staffing" and "Other Operational" inefficiencies identified in the data by keeping teams aligned.
Implementation Strategy: Moving Toward Top Quartile Performance
Achieving the 97% runtime seen in top-quartile performers is a journey. It requires a pragmatic approach that acknowledges the unique context of each facility.
Step 1: Establish a Baseline
Before setting targets, use sensors to measure the actual utilization of your grinders. Is it closer to the 59% median or the 28% bottom quartile? (Source: Guidewheel Performance Analysis).
Step 2: Attack the "Frequency" Killers
Focus first on the Mechanical Breakdowns (0.12 events/shift). Use amperage alerts to detect jams or overloads early. Reducing these frequent stops stabilizes the process.
Step 3: Optimize the "Duration" Killers
Analyze the Maintenance & Cleaning events (3.5 hours avg). Use trend data to predict blade wear so that changes can be scheduled during planned downtime rather than interrupting production.
Step 4: Continuous Improvement
Use the data to foster a culture of experimentation. If you change the screen size or feed rate, does the energy efficiency improve? Does the jam frequency drop? Data turns these guesses into known facts.
Start Optimizing Your Operations
The data is clear: while the median plastic scrap grinder runs only about 60% of the time, the potential exists to nearly double that capacity. Unlocking this potential does not necessarily require buying more machines; it requires better visibility into the machines you already have.
By addressing the specific downtime drivers—maintenance duration and mechanical breakdown frequency—plant managers can transform their grinding operations from a bottleneck into a competitive advantage.
Ready to uncover the hidden capacity in your facility? Book a demo with Guidewheel to see how simple, effective monitoring can transform your production.
About the Author
Lauren Dunford is the CEO and Co-Founder of Guidewheel, a FactoryOps platform that empowers factories to reach a sustainable peak of performance. A graduate of Stanford, she is a JOURNEY Fellow and World Economic Forum Tech Pioneer. Watch her TED Talk—the future isn’t just coded, it’s built.

